Immigrants from Cameroon vs German Russian Unemployment Among Seniors over 65 years
COMPARE
Immigrants from Cameroon
German Russian
Unemployment Among Seniors over 65 years
Unemployment Among Seniors over 65 years Comparison
Immigrants from Cameroon
German Russians
5.1%
UNEMPLOYMENT AMONG SENIORS OVER 65 YEARS
88.6/ 100
METRIC RATING
122nd/ 347
METRIC RANK
5.2%
UNEMPLOYMENT AMONG SENIORS OVER 65 YEARS
14.7/ 100
METRIC RATING
206th/ 347
METRIC RANK
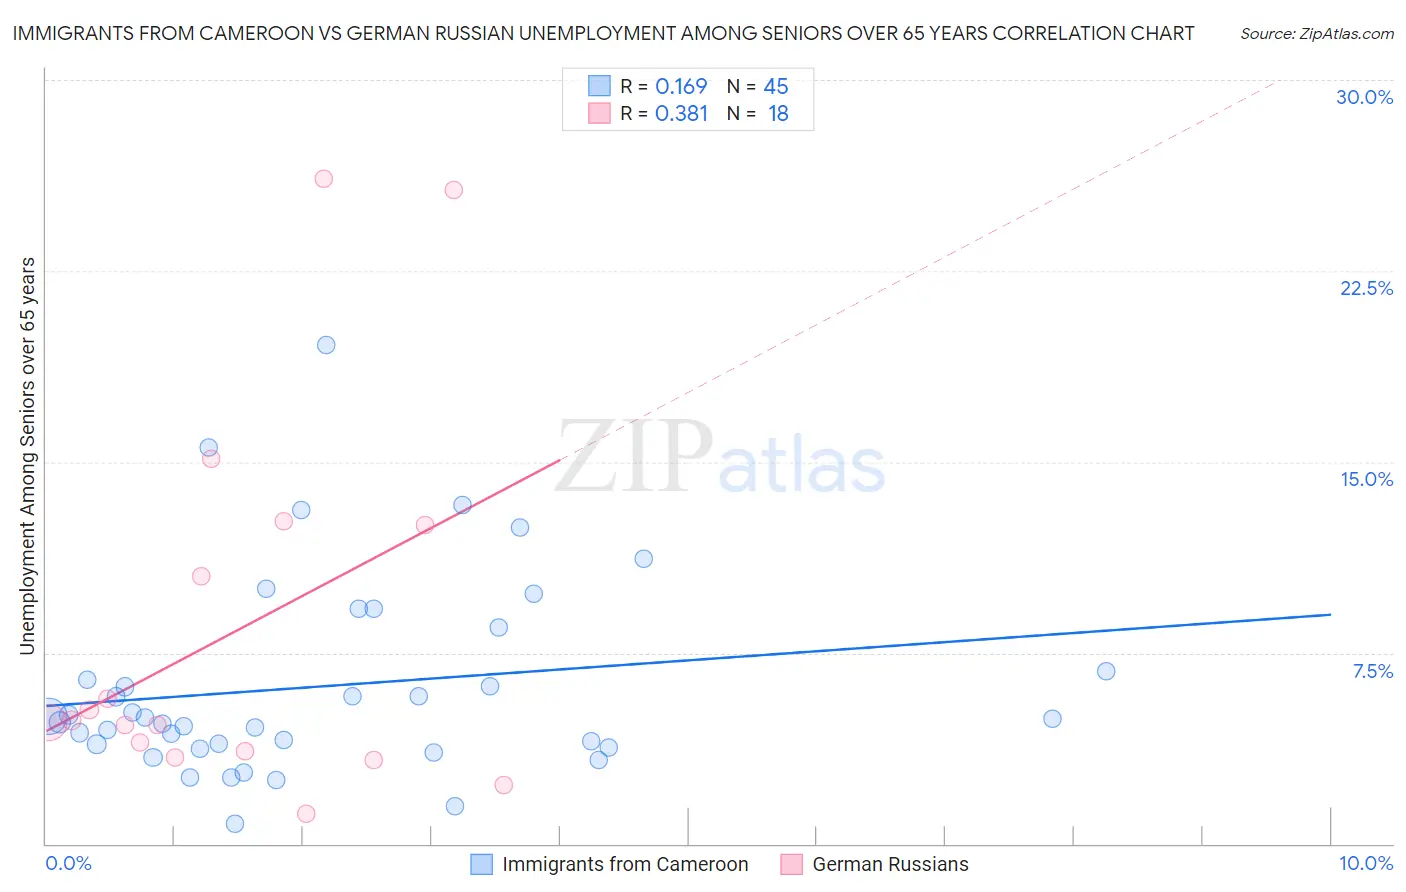
Immigrants from Cameroon vs German Russian Unemployment Among Seniors over 65 years Correlation Chart
The statistical analysis conducted on geographies consisting of 125,322,101 people shows a poor positive correlation between the proportion of Immigrants from Cameroon and unemployment rate amomg seniors over the age of 65 in the United States with a correlation coefficient (R) of 0.169 and weighted average of 5.1%. Similarly, the statistical analysis conducted on geographies consisting of 91,757,788 people shows a mild positive correlation between the proportion of German Russians and unemployment rate amomg seniors over the age of 65 in the United States with a correlation coefficient (R) of 0.381 and weighted average of 5.2%, a difference of 3.1%.
Unemployment Among Seniors over 65 years Correlation Summary
| Measurement | Immigrants from Cameroon | German Russian |
| Minimum | 0.80% | 1.2% |
| Maximum | 19.6% | 26.1% |
| Range | 18.8% | 24.9% |
| Mean | 6.2% | 8.3% |
| Median | 4.9% | 4.8% |
| Interquartile 25% (IQ1) | 3.9% | 3.6% |
| Interquartile 75% (IQ3) | 7.6% | 12.5% |
| Interquartile Range (IQR) | 3.8% | 8.9% |
| Standard Deviation (Sample) | 3.9% | 7.5% |
| Standard Deviation (Population) | 3.8% | 7.3% |
Similar Demographics by Unemployment Among Seniors over 65 years
Demographics Similar to Immigrants from Cameroon by Unemployment Among Seniors over 65 years
In terms of unemployment among seniors over 65 years, the demographic groups most similar to Immigrants from Cameroon are Asian (5.1%, a difference of 0.0%), Puget Sound Salish (5.1%, a difference of 0.010%), Irish (5.1%, a difference of 0.020%), Immigrants from North America (5.1%, a difference of 0.050%), and Dutch (5.1%, a difference of 0.070%).
| Demographics | Rating | Rank | Unemployment Among Seniors over 65 years |
| Celtics | 91.3 /100 | #115 | Exceptional 5.0% |
| Immigrants | Korea | 91.0 /100 | #116 | Exceptional 5.0% |
| Malaysians | 90.4 /100 | #117 | Exceptional 5.1% |
| Soviet Union | 90.1 /100 | #118 | Exceptional 5.1% |
| Immigrants | Canada | 89.7 /100 | #119 | Excellent 5.1% |
| Irish | 88.8 /100 | #120 | Excellent 5.1% |
| Puget Sound Salish | 88.7 /100 | #121 | Excellent 5.1% |
| Immigrants | Cameroon | 88.6 /100 | #122 | Excellent 5.1% |
| Asians | 88.5 /100 | #123 | Excellent 5.1% |
| Immigrants | North America | 87.9 /100 | #124 | Excellent 5.1% |
| Dutch | 87.6 /100 | #125 | Excellent 5.1% |
| Immigrants | Sri Lanka | 87.4 /100 | #126 | Excellent 5.1% |
| Sri Lankans | 87.4 /100 | #127 | Excellent 5.1% |
| Australians | 87.1 /100 | #128 | Excellent 5.1% |
| Immigrants | England | 86.7 /100 | #129 | Excellent 5.1% |
Demographics Similar to German Russians by Unemployment Among Seniors over 65 years
In terms of unemployment among seniors over 65 years, the demographic groups most similar to German Russians are South American Indian (5.2%, a difference of 0.040%), Immigrants from Philippines (5.2%, a difference of 0.10%), Immigrants from China (5.2%, a difference of 0.13%), Subsaharan African (5.2%, a difference of 0.14%), and Uruguayan (5.2%, a difference of 0.14%).
| Demographics | Rating | Rank | Unemployment Among Seniors over 65 years |
| Immigrants | Europe | 19.0 /100 | #199 | Poor 5.2% |
| Immigrants | Pakistan | 18.4 /100 | #200 | Poor 5.2% |
| Laotians | 18.1 /100 | #201 | Poor 5.2% |
| Immigrants | Northern Africa | 17.7 /100 | #202 | Poor 5.2% |
| Sub-Saharan Africans | 17.1 /100 | #203 | Poor 5.2% |
| Immigrants | China | 16.9 /100 | #204 | Poor 5.2% |
| South American Indians | 15.3 /100 | #205 | Poor 5.2% |
| German Russians | 14.7 /100 | #206 | Poor 5.2% |
| Immigrants | Philippines | 13.2 /100 | #207 | Poor 5.2% |
| Uruguayans | 12.6 /100 | #208 | Poor 5.2% |
| Alsatians | 11.4 /100 | #209 | Poor 5.2% |
| Immigrants | Uzbekistan | 10.7 /100 | #210 | Poor 5.2% |
| Africans | 10.4 /100 | #211 | Poor 5.2% |
| Immigrants | Honduras | 10.2 /100 | #212 | Poor 5.2% |
| Immigrants | Uruguay | 9.3 /100 | #213 | Tragic 5.2% |