Immigrants from Cambodia vs Tlingit-Haida Family Poverty
COMPARE
Immigrants from Cambodia
Tlingit-Haida
Family Poverty
Family Poverty Comparison
Immigrants from Cambodia
Tlingit-Haida
9.9%
FAMILY POVERTY
4.8/ 100
METRIC RATING
221st/ 347
METRIC RANK
8.0%
FAMILY POVERTY
96.7/ 100
METRIC RATING
93rd/ 347
METRIC RANK
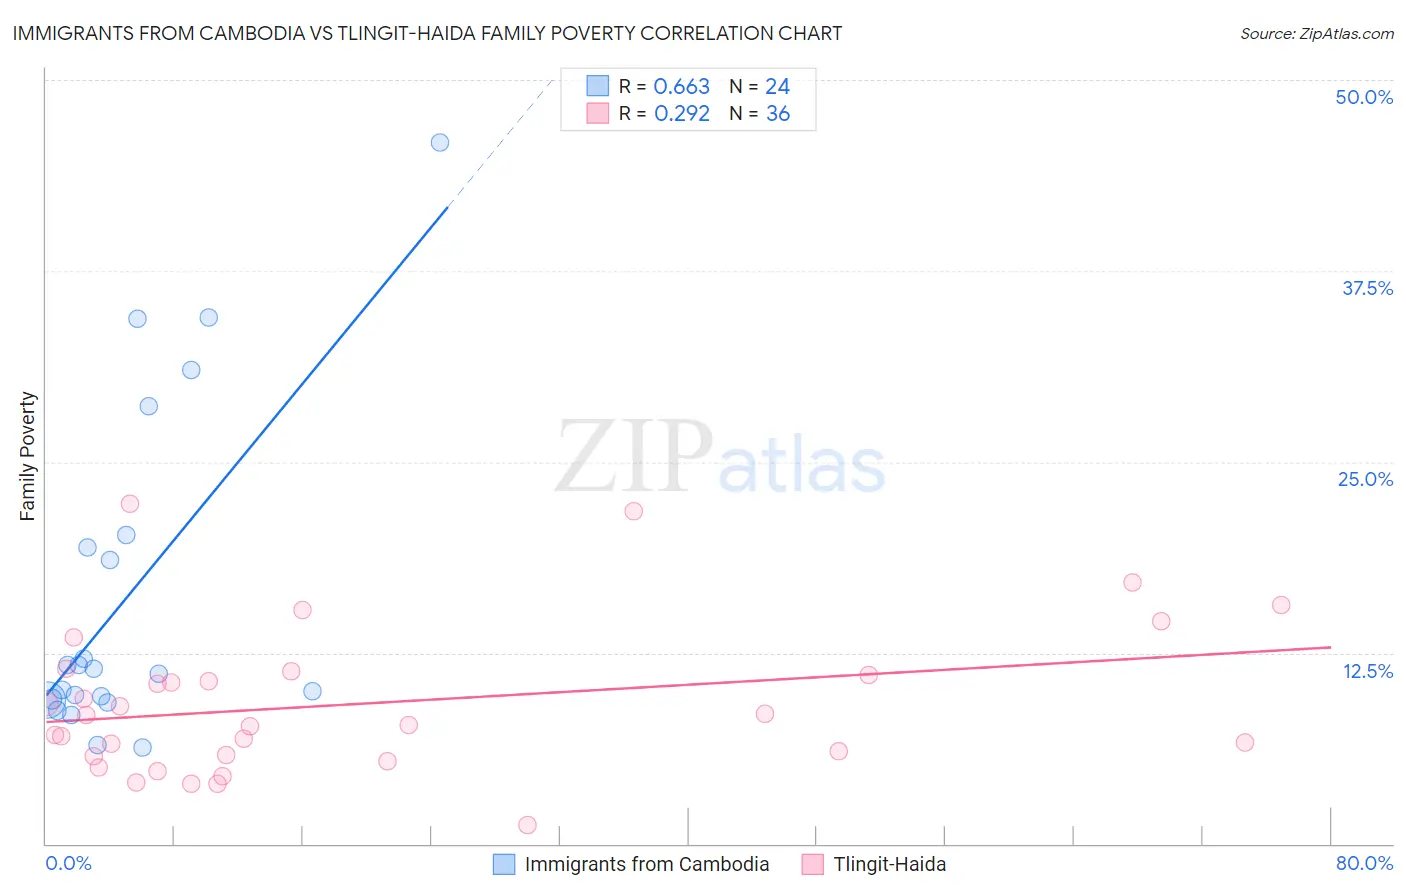
Immigrants from Cambodia vs Tlingit-Haida Family Poverty Correlation Chart
The statistical analysis conducted on geographies consisting of 204,985,132 people shows a significant positive correlation between the proportion of Immigrants from Cambodia and poverty level among families in the United States with a correlation coefficient (R) of 0.663 and weighted average of 9.9%. Similarly, the statistical analysis conducted on geographies consisting of 60,804,034 people shows a weak positive correlation between the proportion of Tlingit-Haida and poverty level among families in the United States with a correlation coefficient (R) of 0.292 and weighted average of 8.0%, a difference of 23.3%.
Family Poverty Correlation Summary
| Measurement | Immigrants from Cambodia | Tlingit-Haida |
| Minimum | 6.3% | 1.3% |
| Maximum | 45.9% | 22.2% |
| Range | 39.6% | 21.0% |
| Mean | 16.2% | 9.2% |
| Median | 11.3% | 8.1% |
| Interquartile 25% (IQ1) | 9.4% | 5.8% |
| Interquartile 75% (IQ3) | 19.8% | 11.2% |
| Interquartile Range (IQR) | 10.4% | 5.4% |
| Standard Deviation (Sample) | 10.8% | 4.8% |
| Standard Deviation (Population) | 10.5% | 4.8% |
Similar Demographics by Family Poverty
Demographics Similar to Immigrants from Cambodia by Family Poverty
In terms of family poverty, the demographic groups most similar to Immigrants from Cambodia are Japanese (9.9%, a difference of 0.030%), Bermudan (9.9%, a difference of 0.27%), Immigrants from Eritrea (9.9%, a difference of 0.33%), Immigrants from Africa (9.9%, a difference of 0.33%), and Panamanian (9.8%, a difference of 0.46%).
| Demographics | Rating | Rank | Family Poverty |
| Immigrants | Micronesia | 6.7 /100 | #214 | Tragic 9.8% |
| Immigrants | Nonimmigrants | 6.7 /100 | #215 | Tragic 9.8% |
| Moroccans | 6.5 /100 | #216 | Tragic 9.8% |
| Americans | 6.2 /100 | #217 | Tragic 9.8% |
| Panamanians | 5.6 /100 | #218 | Tragic 9.8% |
| Immigrants | Eritrea | 5.4 /100 | #219 | Tragic 9.9% |
| Bermudans | 5.3 /100 | #220 | Tragic 9.9% |
| Immigrants | Cambodia | 4.8 /100 | #221 | Tragic 9.9% |
| Japanese | 4.8 /100 | #222 | Tragic 9.9% |
| Immigrants | Africa | 4.3 /100 | #223 | Tragic 9.9% |
| Marshallese | 3.9 /100 | #224 | Tragic 9.9% |
| Immigrants | Immigrants | 3.6 /100 | #225 | Tragic 10.0% |
| Ottawa | 3.3 /100 | #226 | Tragic 10.0% |
| Immigrants | Armenia | 3.3 /100 | #227 | Tragic 10.0% |
| Sudanese | 3.1 /100 | #228 | Tragic 10.0% |
Demographics Similar to Tlingit-Haida by Family Poverty
In terms of family poverty, the demographic groups most similar to Tlingit-Haida are Immigrants from Pakistan (8.0%, a difference of 0.11%), Immigrants from Philippines (8.0%, a difference of 0.12%), Immigrants from Turkey (8.0%, a difference of 0.14%), Czechoslovakian (8.0%, a difference of 0.18%), and Immigrants from Italy (8.0%, a difference of 0.42%).
| Demographics | Rating | Rank | Family Poverty |
| Scottish | 97.3 /100 | #86 | Exceptional 7.9% |
| Belgians | 97.3 /100 | #87 | Exceptional 8.0% |
| Serbians | 97.2 /100 | #88 | Exceptional 8.0% |
| Immigrants | Denmark | 97.1 /100 | #89 | Exceptional 8.0% |
| Immigrants | England | 97.1 /100 | #90 | Exceptional 8.0% |
| Immigrants | Italy | 97.0 /100 | #91 | Exceptional 8.0% |
| Czechoslovakians | 96.8 /100 | #92 | Exceptional 8.0% |
| Tlingit-Haida | 96.7 /100 | #93 | Exceptional 8.0% |
| Immigrants | Pakistan | 96.6 /100 | #94 | Exceptional 8.0% |
| Immigrants | Philippines | 96.5 /100 | #95 | Exceptional 8.0% |
| Immigrants | Turkey | 96.5 /100 | #96 | Exceptional 8.0% |
| Immigrants | Switzerland | 96.1 /100 | #97 | Exceptional 8.1% |
| Immigrants | South Africa | 95.9 /100 | #98 | Exceptional 8.1% |
| Welsh | 95.8 /100 | #99 | Exceptional 8.1% |
| New Zealanders | 95.8 /100 | #100 | Exceptional 8.1% |