Immigrants from Cambodia vs Scottish Single Father Poverty
COMPARE
Immigrants from Cambodia
Scottish
Single Father Poverty
Single Father Poverty Comparison
Immigrants from Cambodia
Scottish
14.9%
SINGLE FATHER POVERTY
99.9/ 100
METRIC RATING
46th/ 347
METRIC RANK
17.7%
SINGLE FATHER POVERTY
0.0/ 100
METRIC RATING
280th/ 347
METRIC RANK
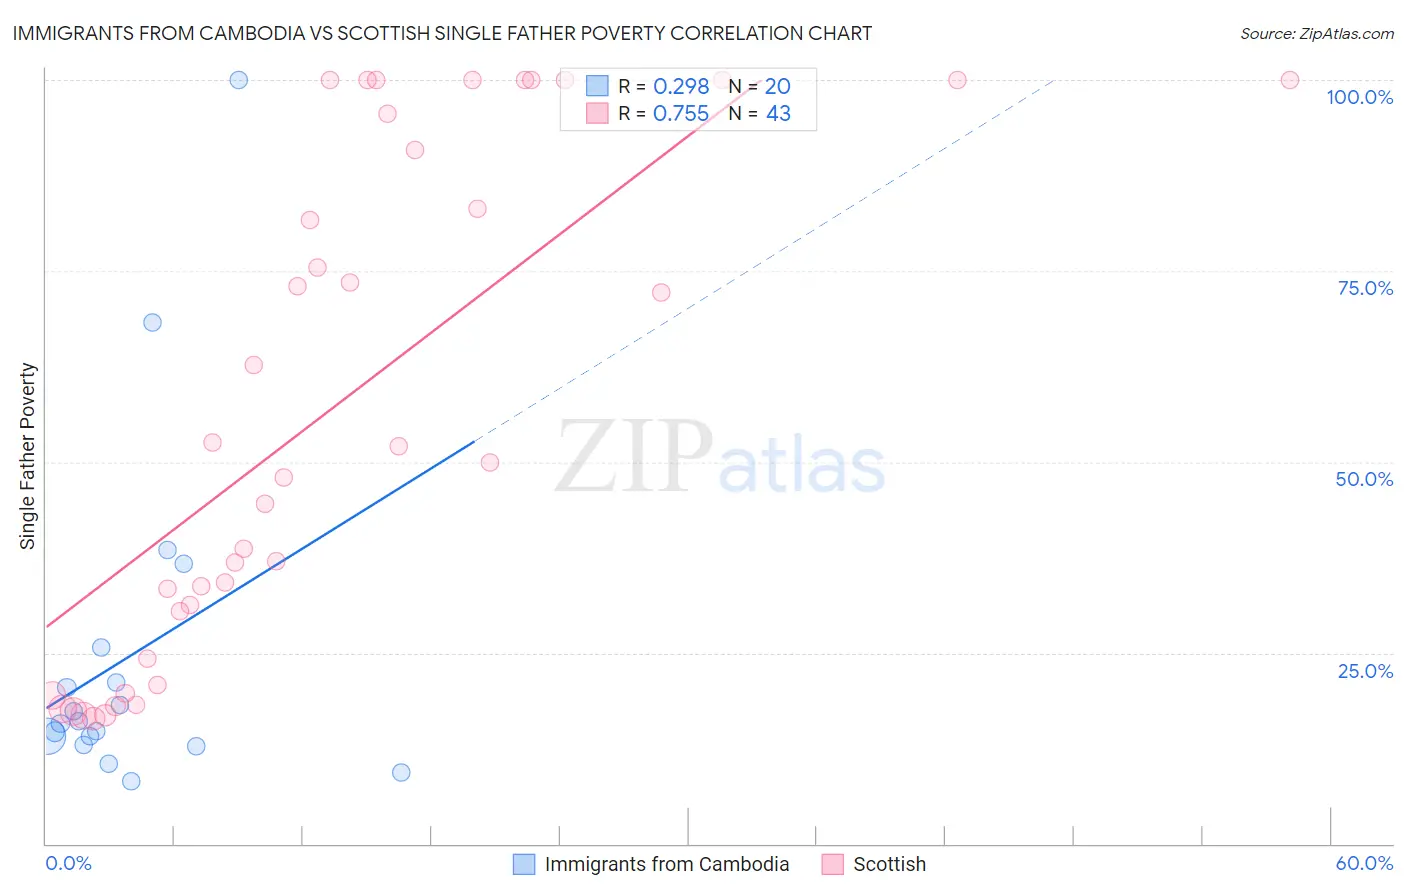
Immigrants from Cambodia vs Scottish Single Father Poverty Correlation Chart
The statistical analysis conducted on geographies consisting of 178,014,507 people shows a weak positive correlation between the proportion of Immigrants from Cambodia and poverty level among single fathers in the United States with a correlation coefficient (R) of 0.298 and weighted average of 14.9%. Similarly, the statistical analysis conducted on geographies consisting of 405,098,352 people shows a strong positive correlation between the proportion of Scottish and poverty level among single fathers in the United States with a correlation coefficient (R) of 0.755 and weighted average of 17.7%, a difference of 18.8%.
Single Father Poverty Correlation Summary
| Measurement | Immigrants from Cambodia | Scottish |
| Minimum | 8.1% | 16.4% |
| Maximum | 100.0% | 100.0% |
| Range | 91.9% | 83.6% |
| Mean | 24.5% | 56.6% |
| Median | 15.9% | 50.0% |
| Interquartile 25% (IQ1) | 13.6% | 24.3% |
| Interquartile 75% (IQ3) | 23.4% | 95.6% |
| Interquartile Range (IQR) | 9.8% | 71.3% |
| Standard Deviation (Sample) | 22.5% | 32.4% |
| Standard Deviation (Population) | 21.9% | 32.1% |
Similar Demographics by Single Father Poverty
Demographics Similar to Immigrants from Cambodia by Single Father Poverty
In terms of single father poverty, the demographic groups most similar to Immigrants from Cambodia are Immigrants from China (14.9%, a difference of 0.030%), Malaysian (14.9%, a difference of 0.030%), Immigrants from Somalia (14.9%, a difference of 0.12%), Immigrants from Eastern Asia (15.0%, a difference of 0.19%), and Bhutanese (15.0%, a difference of 0.24%).
| Demographics | Rating | Rank | Single Father Poverty |
| Immigrants | Asia | 100.0 /100 | #39 | Exceptional 14.7% |
| Pima | 100.0 /100 | #40 | Exceptional 14.8% |
| Indians (Asian) | 100.0 /100 | #41 | Exceptional 14.8% |
| Immigrants | Nepal | 100.0 /100 | #42 | Exceptional 14.8% |
| Immigrants | Eritrea | 100.0 /100 | #43 | Exceptional 14.8% |
| Salvadorans | 100.0 /100 | #44 | Exceptional 14.9% |
| Immigrants | Somalia | 100.0 /100 | #45 | Exceptional 14.9% |
| Immigrants | Cambodia | 99.9 /100 | #46 | Exceptional 14.9% |
| Immigrants | China | 99.9 /100 | #47 | Exceptional 14.9% |
| Malaysians | 99.9 /100 | #48 | Exceptional 14.9% |
| Immigrants | Eastern Asia | 99.9 /100 | #49 | Exceptional 15.0% |
| Bhutanese | 99.9 /100 | #50 | Exceptional 15.0% |
| Immigrants | Pakistan | 99.9 /100 | #51 | Exceptional 15.0% |
| Immigrants | El Salvador | 99.9 /100 | #52 | Exceptional 15.0% |
| Immigrants | Kenya | 99.9 /100 | #53 | Exceptional 15.0% |
Demographics Similar to Scottish by Single Father Poverty
In terms of single father poverty, the demographic groups most similar to Scottish are Iroquois (17.7%, a difference of 0.050%), German (17.7%, a difference of 0.19%), Lebanese (17.7%, a difference of 0.20%), English (17.8%, a difference of 0.32%), and Dutch (17.8%, a difference of 0.32%).
| Demographics | Rating | Rank | Single Father Poverty |
| Italians | 0.1 /100 | #273 | Tragic 17.5% |
| Macedonians | 0.1 /100 | #274 | Tragic 17.7% |
| British West Indians | 0.0 /100 | #275 | Tragic 17.7% |
| German Russians | 0.0 /100 | #276 | Tragic 17.7% |
| Lebanese | 0.0 /100 | #277 | Tragic 17.7% |
| Germans | 0.0 /100 | #278 | Tragic 17.7% |
| Iroquois | 0.0 /100 | #279 | Tragic 17.7% |
| Scottish | 0.0 /100 | #280 | Tragic 17.7% |
| English | 0.0 /100 | #281 | Tragic 17.8% |
| Dutch | 0.0 /100 | #282 | Tragic 17.8% |
| Alsatians | 0.0 /100 | #283 | Tragic 17.8% |
| Welsh | 0.0 /100 | #284 | Tragic 17.8% |
| Immigrants | Lebanon | 0.0 /100 | #285 | Tragic 17.9% |
| Immigrants | North Macedonia | 0.0 /100 | #286 | Tragic 17.9% |
| Carpatho Rusyns | 0.0 /100 | #287 | Tragic 18.0% |