Immigrants from Cabo Verde vs Lebanese Child Poverty Among Boys Under 16
COMPARE
Immigrants from Cabo Verde
Lebanese
Child Poverty Among Boys Under 16
Child Poverty Among Boys Under 16 Comparison
Immigrants from Cabo Verde
Lebanese
19.7%
CHILD POVERTY AMONG BOYS UNDER 16
0.1/ 100
METRIC RATING
269th/ 347
METRIC RANK
16.6%
CHILD POVERTY AMONG BOYS UNDER 16
43.3/ 100
METRIC RATING
182nd/ 347
METRIC RANK
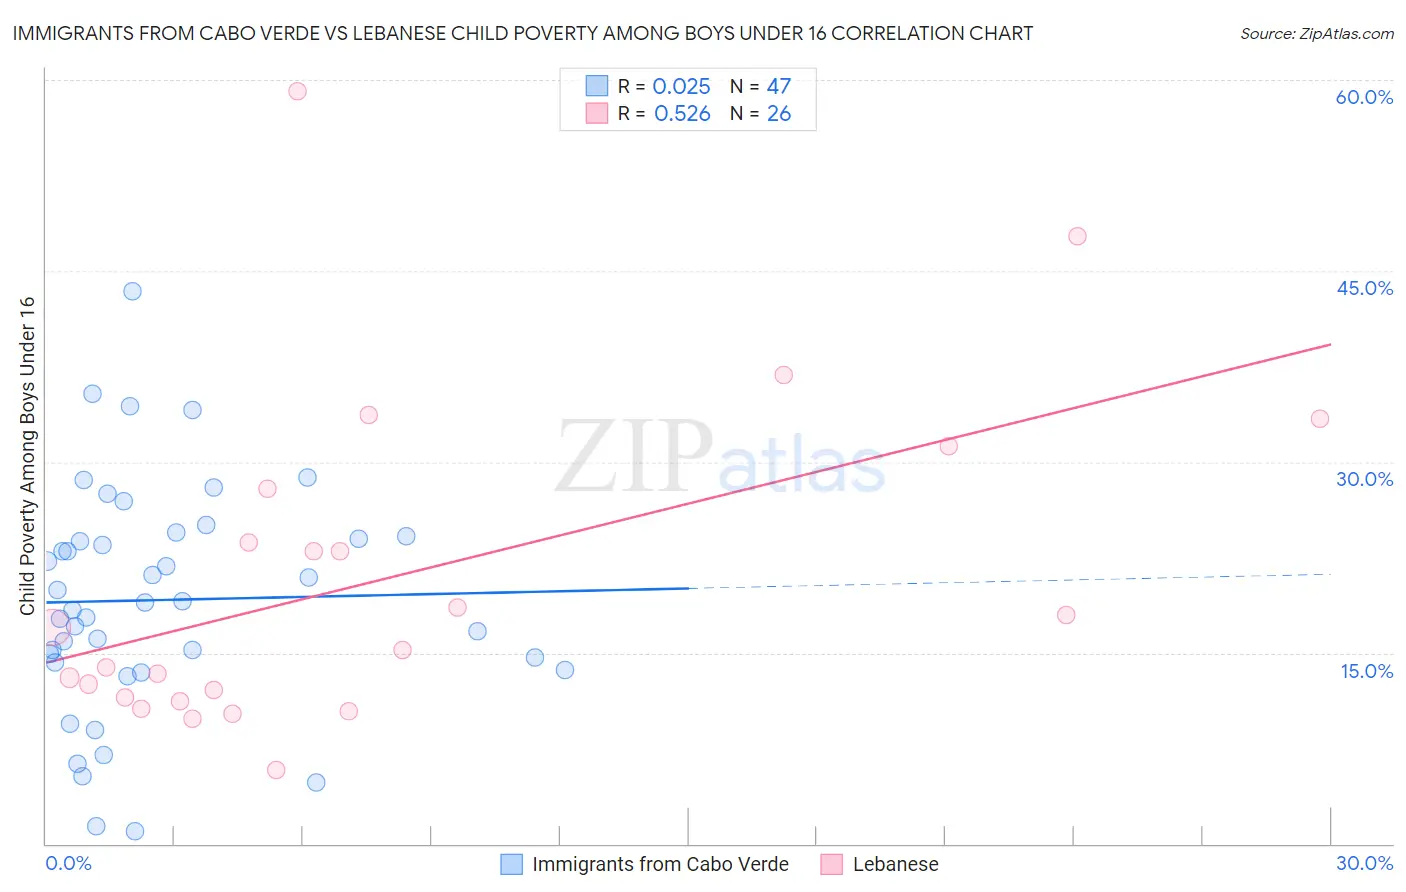
Immigrants from Cabo Verde vs Lebanese Child Poverty Among Boys Under 16 Correlation Chart
The statistical analysis conducted on geographies consisting of 37,877,952 people shows no correlation between the proportion of Immigrants from Cabo Verde and poverty level among boys under the age of 16 in the United States with a correlation coefficient (R) of 0.025 and weighted average of 19.7%. Similarly, the statistical analysis conducted on geographies consisting of 393,704,945 people shows a substantial positive correlation between the proportion of Lebanese and poverty level among boys under the age of 16 in the United States with a correlation coefficient (R) of 0.526 and weighted average of 16.6%, a difference of 18.7%.
Child Poverty Among Boys Under 16 Correlation Summary
| Measurement | Immigrants from Cabo Verde | Lebanese |
| Minimum | 1.0% | 5.8% |
| Maximum | 43.4% | 59.1% |
| Range | 42.4% | 53.3% |
| Mean | 19.1% | 20.9% |
| Median | 18.9% | 16.1% |
| Interquartile 25% (IQ1) | 14.2% | 11.5% |
| Interquartile 75% (IQ3) | 24.2% | 27.9% |
| Interquartile Range (IQR) | 10.0% | 16.4% |
| Standard Deviation (Sample) | 8.9% | 12.9% |
| Standard Deviation (Population) | 8.8% | 12.7% |
Similar Demographics by Child Poverty Among Boys Under 16
Demographics Similar to Immigrants from Cabo Verde by Child Poverty Among Boys Under 16
In terms of child poverty among boys under 16, the demographic groups most similar to Immigrants from Cabo Verde are Spanish American Indian (19.6%, a difference of 0.16%), Vietnamese (19.6%, a difference of 0.27%), Cherokee (19.7%, a difference of 0.28%), Immigrants from El Salvador (19.6%, a difference of 0.29%), and Guyanese (19.6%, a difference of 0.33%).
| Demographics | Rating | Rank | Child Poverty Among Boys Under 16 |
| Immigrants | Guyana | 0.1 /100 | #262 | Tragic 19.5% |
| Ottawa | 0.1 /100 | #263 | Tragic 19.5% |
| Iroquois | 0.1 /100 | #264 | Tragic 19.6% |
| Guyanese | 0.1 /100 | #265 | Tragic 19.6% |
| Immigrants | El Salvador | 0.1 /100 | #266 | Tragic 19.6% |
| Vietnamese | 0.1 /100 | #267 | Tragic 19.6% |
| Spanish American Indians | 0.1 /100 | #268 | Tragic 19.6% |
| Immigrants | Cabo Verde | 0.1 /100 | #269 | Tragic 19.7% |
| Cherokee | 0.1 /100 | #270 | Tragic 19.7% |
| Chickasaw | 0.1 /100 | #271 | Tragic 19.8% |
| Immigrants | Ecuador | 0.1 /100 | #272 | Tragic 19.8% |
| Belizeans | 0.1 /100 | #273 | Tragic 19.9% |
| Immigrants | Bangladesh | 0.0 /100 | #274 | Tragic 19.9% |
| Jamaicans | 0.0 /100 | #275 | Tragic 20.0% |
| Sub-Saharan Africans | 0.0 /100 | #276 | Tragic 20.0% |
Demographics Similar to Lebanese by Child Poverty Among Boys Under 16
In terms of child poverty among boys under 16, the demographic groups most similar to Lebanese are South American Indian (16.5%, a difference of 0.11%), Hawaiian (16.5%, a difference of 0.25%), Kenyan (16.6%, a difference of 0.27%), Celtic (16.6%, a difference of 0.30%), and Immigrants from Western Asia (16.6%, a difference of 0.34%).
| Demographics | Rating | Rank | Child Poverty Among Boys Under 16 |
| Immigrants | Syria | 49.0 /100 | #175 | Average 16.5% |
| Whites/Caucasians | 48.2 /100 | #176 | Average 16.5% |
| Ethiopians | 47.8 /100 | #177 | Average 16.5% |
| Scotch-Irish | 47.5 /100 | #178 | Average 16.5% |
| Hungarians | 47.3 /100 | #179 | Average 16.5% |
| Hawaiians | 45.5 /100 | #180 | Average 16.5% |
| South American Indians | 44.3 /100 | #181 | Average 16.5% |
| Lebanese | 43.3 /100 | #182 | Average 16.6% |
| Kenyans | 41.0 /100 | #183 | Average 16.6% |
| Celtics | 40.6 /100 | #184 | Average 16.6% |
| Immigrants | Western Asia | 40.4 /100 | #185 | Average 16.6% |
| Hmong | 38.4 /100 | #186 | Fair 16.6% |
| Immigrants | Costa Rica | 37.8 /100 | #187 | Fair 16.7% |
| Immigrants | South America | 37.7 /100 | #188 | Fair 16.7% |
| Immigrants | Morocco | 34.5 /100 | #189 | Fair 16.7% |