Immigrants from Cabo Verde vs German Russian Child Poverty Among Boys Under 16
COMPARE
Immigrants from Cabo Verde
German Russian
Child Poverty Among Boys Under 16
Child Poverty Among Boys Under 16 Comparison
Immigrants from Cabo Verde
German Russians
19.7%
CHILD POVERTY AMONG BOYS UNDER 16
0.1/ 100
METRIC RATING
269th/ 347
METRIC RANK
17.4%
CHILD POVERTY AMONG BOYS UNDER 16
10.9/ 100
METRIC RATING
206th/ 347
METRIC RANK
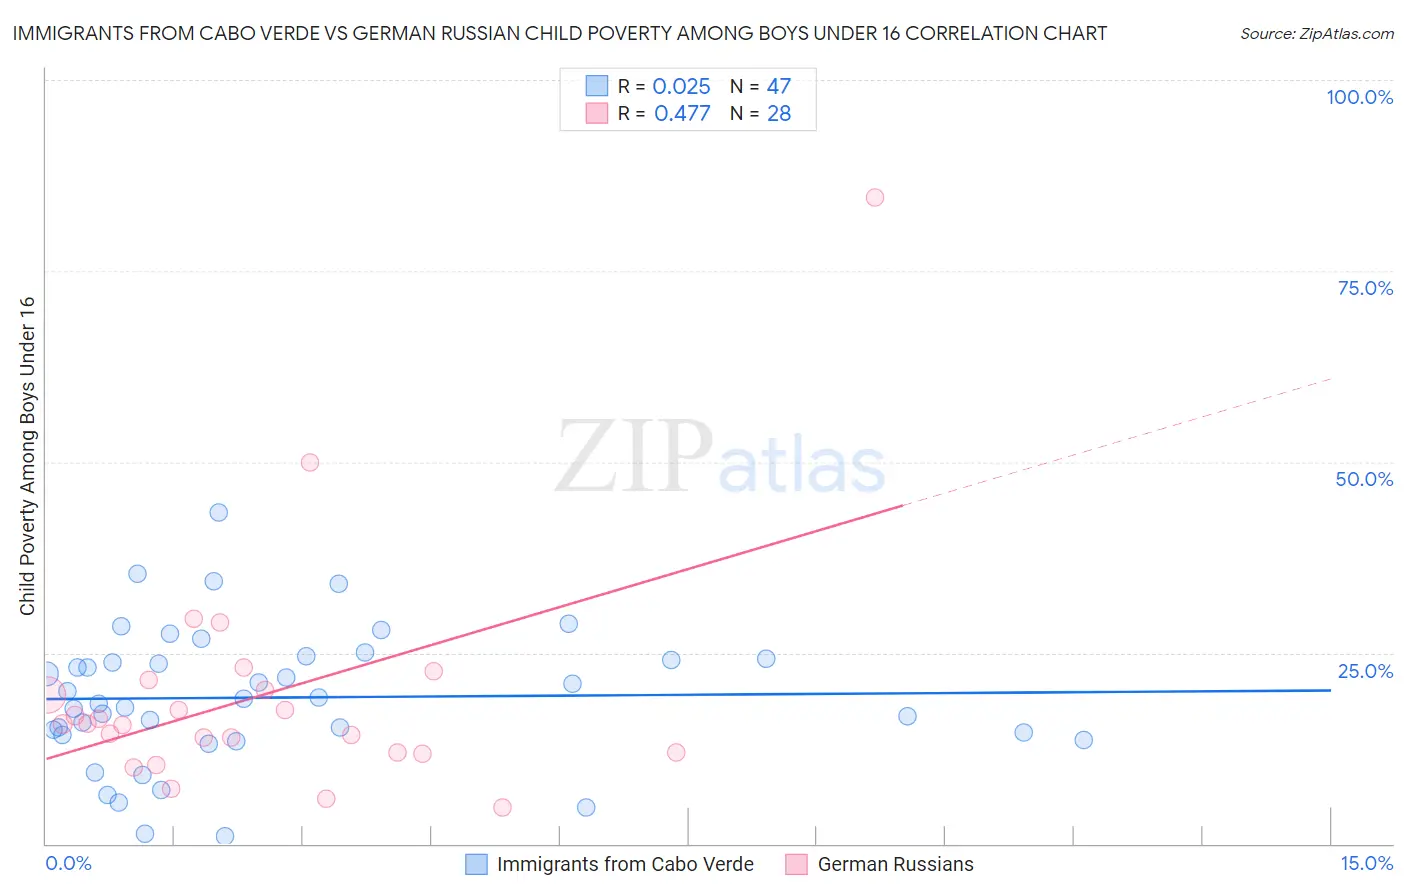
Immigrants from Cabo Verde vs German Russian Child Poverty Among Boys Under 16 Correlation Chart
The statistical analysis conducted on geographies consisting of 37,877,952 people shows no correlation between the proportion of Immigrants from Cabo Verde and poverty level among boys under the age of 16 in the United States with a correlation coefficient (R) of 0.025 and weighted average of 19.7%. Similarly, the statistical analysis conducted on geographies consisting of 95,990,905 people shows a moderate positive correlation between the proportion of German Russians and poverty level among boys under the age of 16 in the United States with a correlation coefficient (R) of 0.477 and weighted average of 17.4%, a difference of 13.0%.
Child Poverty Among Boys Under 16 Correlation Summary
| Measurement | Immigrants from Cabo Verde | German Russian |
| Minimum | 1.0% | 4.7% |
| Maximum | 43.4% | 84.6% |
| Range | 42.4% | 79.9% |
| Mean | 19.1% | 19.5% |
| Median | 18.9% | 15.7% |
| Interquartile 25% (IQ1) | 14.2% | 12.0% |
| Interquartile 75% (IQ3) | 24.2% | 20.8% |
| Interquartile Range (IQR) | 10.0% | 8.8% |
| Standard Deviation (Sample) | 8.9% | 15.5% |
| Standard Deviation (Population) | 8.8% | 15.2% |
Similar Demographics by Child Poverty Among Boys Under 16
Demographics Similar to Immigrants from Cabo Verde by Child Poverty Among Boys Under 16
In terms of child poverty among boys under 16, the demographic groups most similar to Immigrants from Cabo Verde are Spanish American Indian (19.6%, a difference of 0.16%), Vietnamese (19.6%, a difference of 0.27%), Cherokee (19.7%, a difference of 0.28%), Immigrants from El Salvador (19.6%, a difference of 0.29%), and Guyanese (19.6%, a difference of 0.33%).
| Demographics | Rating | Rank | Child Poverty Among Boys Under 16 |
| Immigrants | Guyana | 0.1 /100 | #262 | Tragic 19.5% |
| Ottawa | 0.1 /100 | #263 | Tragic 19.5% |
| Iroquois | 0.1 /100 | #264 | Tragic 19.6% |
| Guyanese | 0.1 /100 | #265 | Tragic 19.6% |
| Immigrants | El Salvador | 0.1 /100 | #266 | Tragic 19.6% |
| Vietnamese | 0.1 /100 | #267 | Tragic 19.6% |
| Spanish American Indians | 0.1 /100 | #268 | Tragic 19.6% |
| Immigrants | Cabo Verde | 0.1 /100 | #269 | Tragic 19.7% |
| Cherokee | 0.1 /100 | #270 | Tragic 19.7% |
| Chickasaw | 0.1 /100 | #271 | Tragic 19.8% |
| Immigrants | Ecuador | 0.1 /100 | #272 | Tragic 19.8% |
| Belizeans | 0.1 /100 | #273 | Tragic 19.9% |
| Immigrants | Bangladesh | 0.0 /100 | #274 | Tragic 19.9% |
| Jamaicans | 0.0 /100 | #275 | Tragic 20.0% |
| Sub-Saharan Africans | 0.0 /100 | #276 | Tragic 20.0% |
Demographics Similar to German Russians by Child Poverty Among Boys Under 16
In terms of child poverty among boys under 16, the demographic groups most similar to German Russians are Immigrants from Portugal (17.4%, a difference of 0.060%), Ugandan (17.3%, a difference of 0.39%), Immigrants from Uzbekistan (17.3%, a difference of 0.59%), Immigrants from Sierra Leone (17.3%, a difference of 0.61%), and Immigrants from Afghanistan (17.3%, a difference of 0.68%).
| Demographics | Rating | Rank | Child Poverty Among Boys Under 16 |
| Delaware | 18.8 /100 | #199 | Poor 17.1% |
| Immigrants | Uruguay | 16.9 /100 | #200 | Poor 17.2% |
| Immigrants | Afghanistan | 13.7 /100 | #201 | Poor 17.3% |
| Immigrants | Sierra Leone | 13.4 /100 | #202 | Poor 17.3% |
| Immigrants | Uzbekistan | 13.3 /100 | #203 | Poor 17.3% |
| Ugandans | 12.5 /100 | #204 | Poor 17.3% |
| Immigrants | Portugal | 11.2 /100 | #205 | Poor 17.4% |
| German Russians | 10.9 /100 | #206 | Poor 17.4% |
| Immigrants | Thailand | 8.2 /100 | #207 | Tragic 17.5% |
| Malaysians | 7.6 /100 | #208 | Tragic 17.6% |
| Alaskan Athabascans | 7.3 /100 | #209 | Tragic 17.6% |
| Immigrants | Armenia | 6.8 /100 | #210 | Tragic 17.6% |
| Immigrants | Immigrants | 6.7 /100 | #211 | Tragic 17.6% |
| Aleuts | 6.6 /100 | #212 | Tragic 17.7% |
| Immigrants | Eastern Africa | 6.0 /100 | #213 | Tragic 17.7% |