Immigrants from Cabo Verde vs Immigrants from Lebanon Child Poverty Among Boys Under 16
COMPARE
Immigrants from Cabo Verde
Immigrants from Lebanon
Child Poverty Among Boys Under 16
Child Poverty Among Boys Under 16 Comparison
Immigrants from Cabo Verde
Immigrants from Lebanon
19.7%
CHILD POVERTY AMONG BOYS UNDER 16
0.1/ 100
METRIC RATING
269th/ 347
METRIC RANK
17.0%
CHILD POVERTY AMONG BOYS UNDER 16
21.2/ 100
METRIC RATING
194th/ 347
METRIC RANK
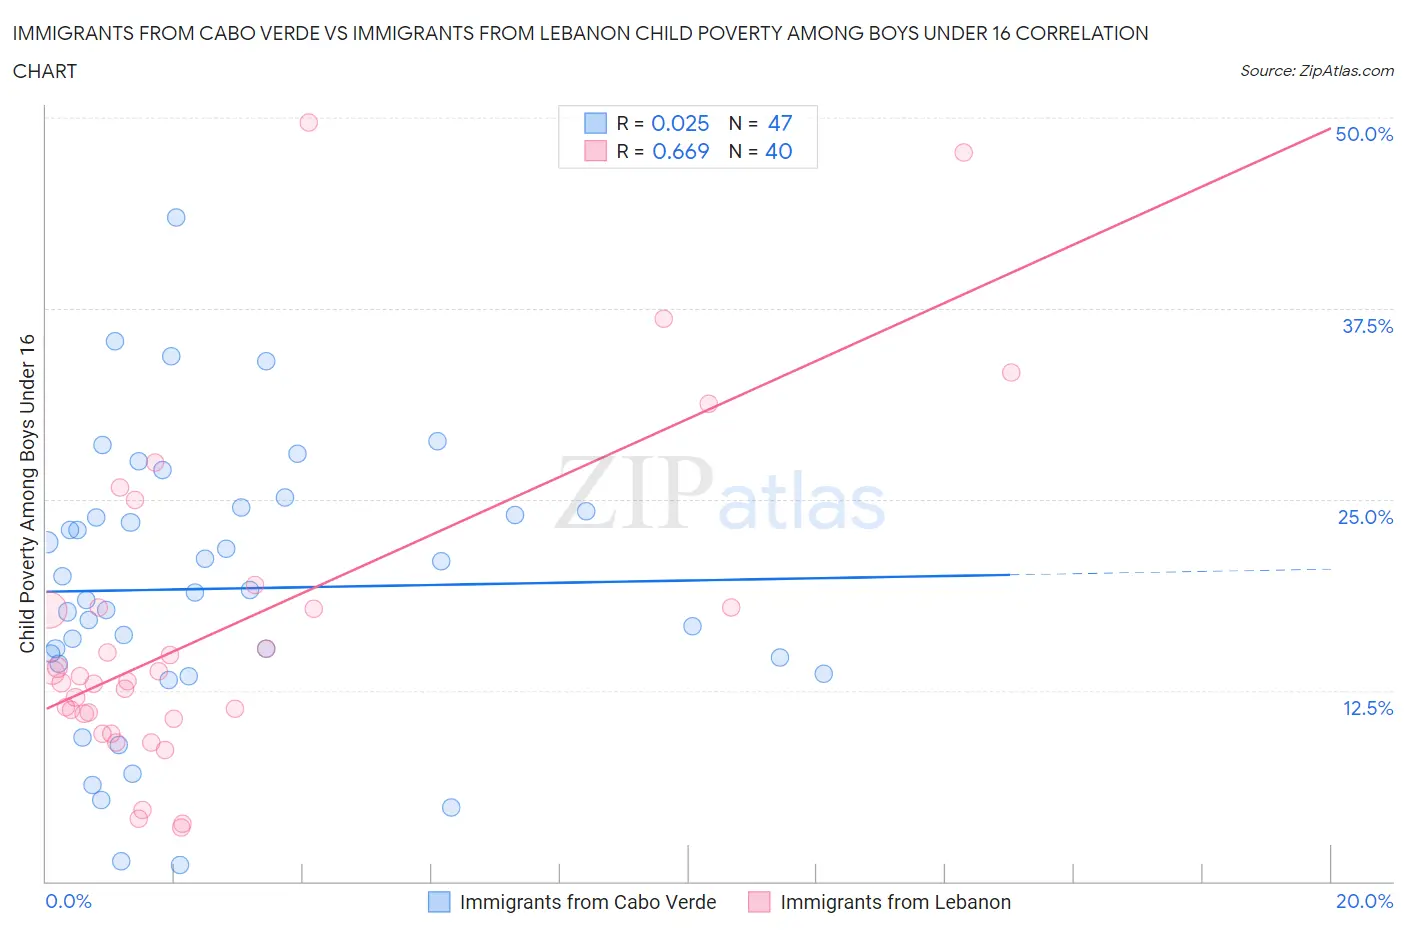
Immigrants from Cabo Verde vs Immigrants from Lebanon Child Poverty Among Boys Under 16 Correlation Chart
The statistical analysis conducted on geographies consisting of 37,877,952 people shows no correlation between the proportion of Immigrants from Cabo Verde and poverty level among boys under the age of 16 in the United States with a correlation coefficient (R) of 0.025 and weighted average of 19.7%. Similarly, the statistical analysis conducted on geographies consisting of 214,958,093 people shows a significant positive correlation between the proportion of Immigrants from Lebanon and poverty level among boys under the age of 16 in the United States with a correlation coefficient (R) of 0.669 and weighted average of 17.0%, a difference of 15.3%.
Child Poverty Among Boys Under 16 Correlation Summary
| Measurement | Immigrants from Cabo Verde | Immigrants from Lebanon |
| Minimum | 1.0% | 3.5% |
| Maximum | 43.4% | 49.7% |
| Range | 42.4% | 46.2% |
| Mean | 19.1% | 16.5% |
| Median | 18.9% | 13.2% |
| Interquartile 25% (IQ1) | 14.2% | 10.8% |
| Interquartile 75% (IQ3) | 24.2% | 17.9% |
| Interquartile Range (IQR) | 10.0% | 7.2% |
| Standard Deviation (Sample) | 8.9% | 10.7% |
| Standard Deviation (Population) | 8.8% | 10.6% |
Similar Demographics by Child Poverty Among Boys Under 16
Demographics Similar to Immigrants from Cabo Verde by Child Poverty Among Boys Under 16
In terms of child poverty among boys under 16, the demographic groups most similar to Immigrants from Cabo Verde are Spanish American Indian (19.6%, a difference of 0.16%), Vietnamese (19.6%, a difference of 0.27%), Cherokee (19.7%, a difference of 0.28%), Immigrants from El Salvador (19.6%, a difference of 0.29%), and Guyanese (19.6%, a difference of 0.33%).
| Demographics | Rating | Rank | Child Poverty Among Boys Under 16 |
| Immigrants | Guyana | 0.1 /100 | #262 | Tragic 19.5% |
| Ottawa | 0.1 /100 | #263 | Tragic 19.5% |
| Iroquois | 0.1 /100 | #264 | Tragic 19.6% |
| Guyanese | 0.1 /100 | #265 | Tragic 19.6% |
| Immigrants | El Salvador | 0.1 /100 | #266 | Tragic 19.6% |
| Vietnamese | 0.1 /100 | #267 | Tragic 19.6% |
| Spanish American Indians | 0.1 /100 | #268 | Tragic 19.6% |
| Immigrants | Cabo Verde | 0.1 /100 | #269 | Tragic 19.7% |
| Cherokee | 0.1 /100 | #270 | Tragic 19.7% |
| Chickasaw | 0.1 /100 | #271 | Tragic 19.8% |
| Immigrants | Ecuador | 0.1 /100 | #272 | Tragic 19.8% |
| Belizeans | 0.1 /100 | #273 | Tragic 19.9% |
| Immigrants | Bangladesh | 0.0 /100 | #274 | Tragic 19.9% |
| Jamaicans | 0.0 /100 | #275 | Tragic 20.0% |
| Sub-Saharan Africans | 0.0 /100 | #276 | Tragic 20.0% |
Demographics Similar to Immigrants from Lebanon by Child Poverty Among Boys Under 16
In terms of child poverty among boys under 16, the demographic groups most similar to Immigrants from Lebanon are Immigrants from Uganda (17.0%, a difference of 0.060%), Immigrants from Iraq (17.0%, a difference of 0.060%), Spanish (17.0%, a difference of 0.070%), Spaniard (17.1%, a difference of 0.12%), and Immigrants from Kenya (17.1%, a difference of 0.18%).
| Demographics | Rating | Rank | Child Poverty Among Boys Under 16 |
| Immigrants | Costa Rica | 37.8 /100 | #187 | Fair 16.7% |
| Immigrants | South America | 37.7 /100 | #188 | Fair 16.7% |
| Immigrants | Morocco | 34.5 /100 | #189 | Fair 16.7% |
| Arabs | 31.1 /100 | #190 | Fair 16.8% |
| Alaska Natives | 29.8 /100 | #191 | Fair 16.8% |
| Immigrants | Uganda | 21.6 /100 | #192 | Fair 17.0% |
| Immigrants | Iraq | 21.6 /100 | #193 | Fair 17.0% |
| Immigrants | Lebanon | 21.2 /100 | #194 | Fair 17.0% |
| Spanish | 20.8 /100 | #195 | Fair 17.0% |
| Spaniards | 20.5 /100 | #196 | Fair 17.1% |
| Immigrants | Kenya | 20.1 /100 | #197 | Fair 17.1% |
| Immigrants | Cameroon | 19.0 /100 | #198 | Poor 17.1% |
| Delaware | 18.8 /100 | #199 | Poor 17.1% |
| Immigrants | Uruguay | 16.9 /100 | #200 | Poor 17.2% |
| Immigrants | Afghanistan | 13.7 /100 | #201 | Poor 17.3% |