Immigrants from Dominican Republic vs Immigrants from Lebanon Child Poverty Among Boys Under 16
COMPARE
Immigrants from Dominican Republic
Immigrants from Lebanon
Child Poverty Among Boys Under 16
Child Poverty Among Boys Under 16 Comparison
Immigrants from Dominican Republic
Immigrants from Lebanon
24.3%
CHILD POVERTY AMONG BOYS UNDER 16
0.0/ 100
METRIC RATING
332nd/ 347
METRIC RANK
17.0%
CHILD POVERTY AMONG BOYS UNDER 16
21.2/ 100
METRIC RATING
194th/ 347
METRIC RANK
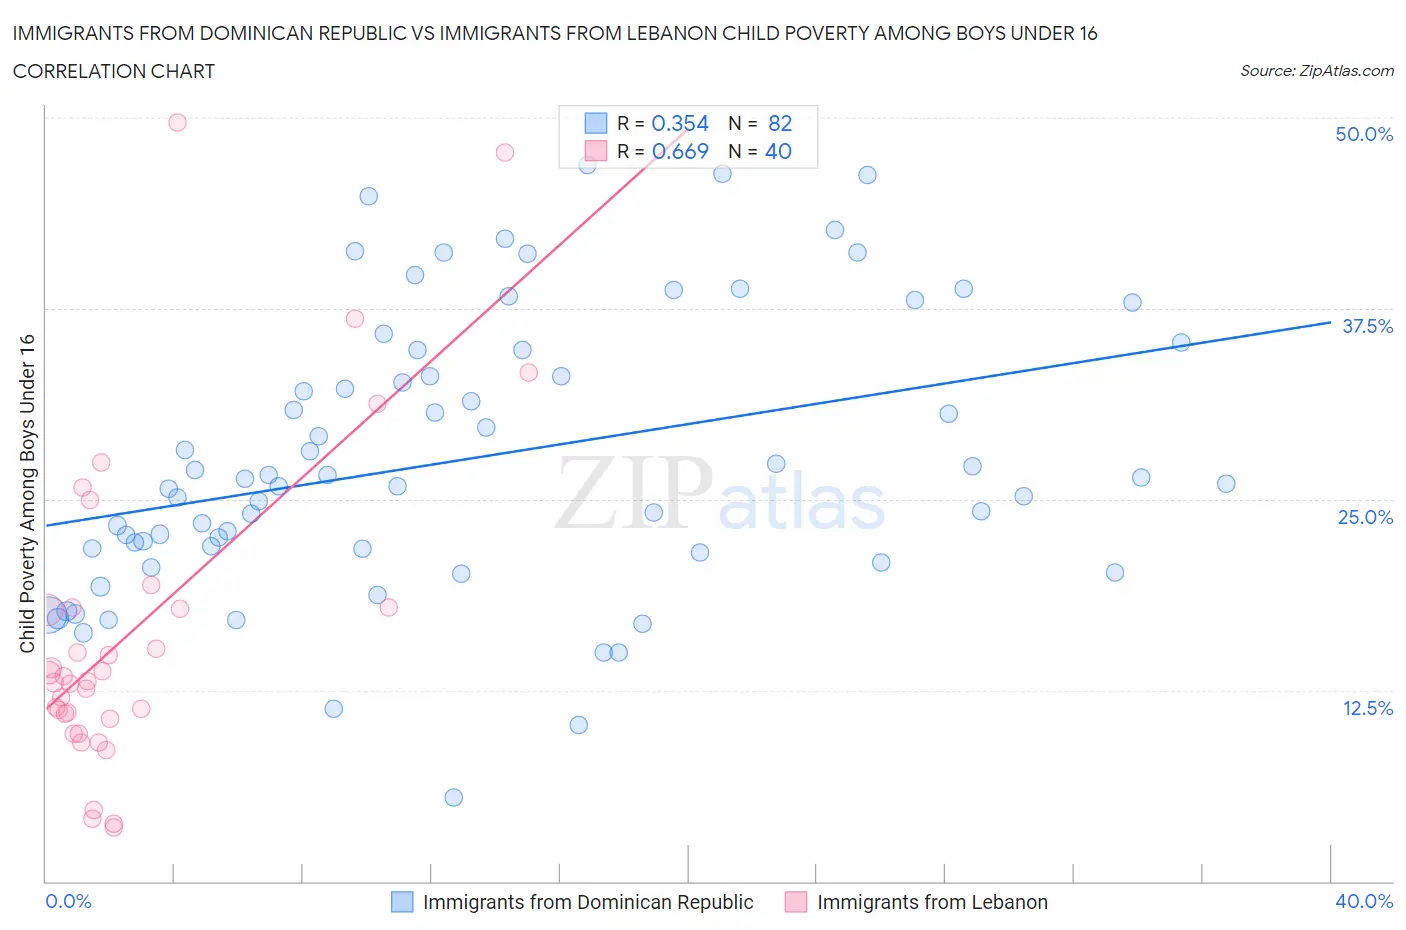
Immigrants from Dominican Republic vs Immigrants from Lebanon Child Poverty Among Boys Under 16 Correlation Chart
The statistical analysis conducted on geographies consisting of 271,516,954 people shows a mild positive correlation between the proportion of Immigrants from Dominican Republic and poverty level among boys under the age of 16 in the United States with a correlation coefficient (R) of 0.354 and weighted average of 24.3%. Similarly, the statistical analysis conducted on geographies consisting of 214,958,093 people shows a significant positive correlation between the proportion of Immigrants from Lebanon and poverty level among boys under the age of 16 in the United States with a correlation coefficient (R) of 0.669 and weighted average of 17.0%, a difference of 42.8%.
Child Poverty Among Boys Under 16 Correlation Summary
| Measurement | Immigrants from Dominican Republic | Immigrants from Lebanon |
| Minimum | 5.5% | 3.5% |
| Maximum | 46.9% | 49.7% |
| Range | 41.4% | 46.2% |
| Mean | 27.7% | 16.5% |
| Median | 26.2% | 13.2% |
| Interquartile 25% (IQ1) | 21.7% | 10.8% |
| Interquartile 75% (IQ3) | 34.8% | 17.9% |
| Interquartile Range (IQR) | 13.0% | 7.2% |
| Standard Deviation (Sample) | 9.2% | 10.7% |
| Standard Deviation (Population) | 9.1% | 10.6% |
Similar Demographics by Child Poverty Among Boys Under 16
Demographics Similar to Immigrants from Dominican Republic by Child Poverty Among Boys Under 16
In terms of child poverty among boys under 16, the demographic groups most similar to Immigrants from Dominican Republic are Dominican (24.2%, a difference of 0.59%), Apache (24.5%, a difference of 0.72%), Black/African American (24.5%, a difference of 0.84%), Colville (24.1%, a difference of 0.93%), and Native/Alaskan (24.0%, a difference of 1.5%).
| Demographics | Rating | Rank | Child Poverty Among Boys Under 16 |
| Central American Indians | 0.0 /100 | #325 | Tragic 22.5% |
| Paiute | 0.0 /100 | #326 | Tragic 22.8% |
| Immigrants | Honduras | 0.0 /100 | #327 | Tragic 22.8% |
| Pueblo | 0.0 /100 | #328 | Tragic 23.5% |
| Natives/Alaskans | 0.0 /100 | #329 | Tragic 24.0% |
| Colville | 0.0 /100 | #330 | Tragic 24.1% |
| Dominicans | 0.0 /100 | #331 | Tragic 24.2% |
| Immigrants | Dominican Republic | 0.0 /100 | #332 | Tragic 24.3% |
| Apache | 0.0 /100 | #333 | Tragic 24.5% |
| Blacks/African Americans | 0.0 /100 | #334 | Tragic 24.5% |
| Yup'ik | 0.0 /100 | #335 | Tragic 24.7% |
| Sioux | 0.0 /100 | #336 | Tragic 25.3% |
| Cheyenne | 0.0 /100 | #337 | Tragic 25.8% |
| Hopi | 0.0 /100 | #338 | Tragic 25.9% |
| Houma | 0.0 /100 | #339 | Tragic 26.2% |
Demographics Similar to Immigrants from Lebanon by Child Poverty Among Boys Under 16
In terms of child poverty among boys under 16, the demographic groups most similar to Immigrants from Lebanon are Immigrants from Uganda (17.0%, a difference of 0.060%), Immigrants from Iraq (17.0%, a difference of 0.060%), Spanish (17.0%, a difference of 0.070%), Spaniard (17.1%, a difference of 0.12%), and Immigrants from Kenya (17.1%, a difference of 0.18%).
| Demographics | Rating | Rank | Child Poverty Among Boys Under 16 |
| Immigrants | Costa Rica | 37.8 /100 | #187 | Fair 16.7% |
| Immigrants | South America | 37.7 /100 | #188 | Fair 16.7% |
| Immigrants | Morocco | 34.5 /100 | #189 | Fair 16.7% |
| Arabs | 31.1 /100 | #190 | Fair 16.8% |
| Alaska Natives | 29.8 /100 | #191 | Fair 16.8% |
| Immigrants | Uganda | 21.6 /100 | #192 | Fair 17.0% |
| Immigrants | Iraq | 21.6 /100 | #193 | Fair 17.0% |
| Immigrants | Lebanon | 21.2 /100 | #194 | Fair 17.0% |
| Spanish | 20.8 /100 | #195 | Fair 17.0% |
| Spaniards | 20.5 /100 | #196 | Fair 17.1% |
| Immigrants | Kenya | 20.1 /100 | #197 | Fair 17.1% |
| Immigrants | Cameroon | 19.0 /100 | #198 | Poor 17.1% |
| Delaware | 18.8 /100 | #199 | Poor 17.1% |
| Immigrants | Uruguay | 16.9 /100 | #200 | Poor 17.2% |
| Immigrants | Afghanistan | 13.7 /100 | #201 | Poor 17.3% |