Immigrants from Burma/Myanmar vs Costa Rican Seniors Poverty Over the Age of 75
COMPARE
Immigrants from Burma/Myanmar
Costa Rican
Seniors Poverty Over the Age of 75
Seniors Poverty Over the Age of 75 Comparison
Immigrants from Burma/Myanmar
Costa Ricans
12.1%
SENIORS POVERTY OVER THE AGE OF 75
62.3/ 100
METRIC RATING
156th/ 347
METRIC RANK
12.8%
SENIORS POVERTY OVER THE AGE OF 75
8.7/ 100
METRIC RATING
207th/ 347
METRIC RANK
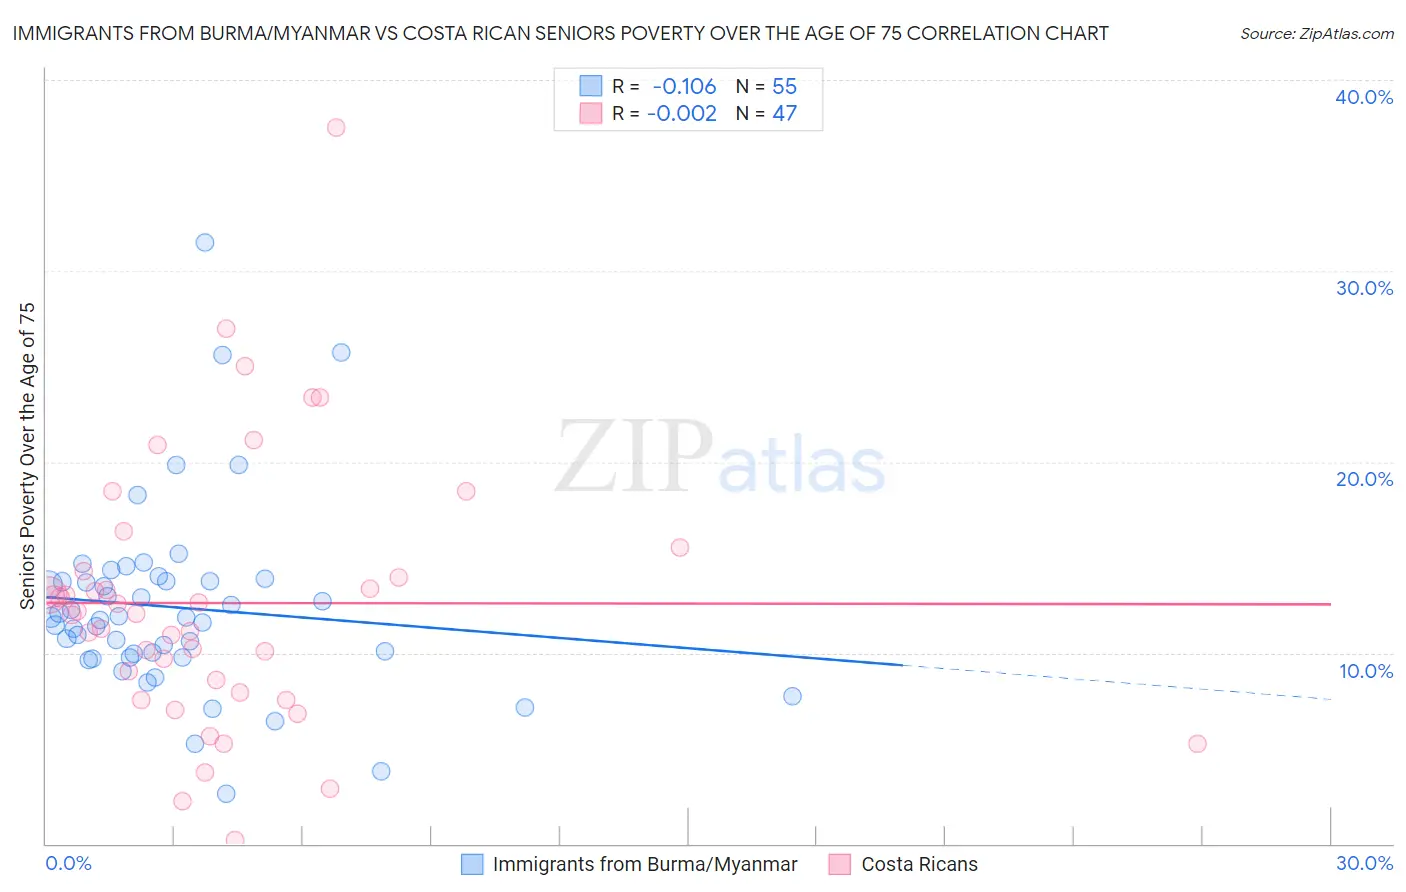
Immigrants from Burma/Myanmar vs Costa Rican Seniors Poverty Over the Age of 75 Correlation Chart
The statistical analysis conducted on geographies consisting of 171,617,389 people shows a poor negative correlation between the proportion of Immigrants from Burma/Myanmar and poverty level among seniors over the age of 75 in the United States with a correlation coefficient (R) of -0.106 and weighted average of 12.1%. Similarly, the statistical analysis conducted on geographies consisting of 251,972,456 people shows no correlation between the proportion of Costa Ricans and poverty level among seniors over the age of 75 in the United States with a correlation coefficient (R) of -0.002 and weighted average of 12.8%, a difference of 5.9%.
Seniors Poverty Over the Age of 75 Correlation Summary
| Measurement | Immigrants from Burma/Myanmar | Costa Rican |
| Minimum | 2.6% | 0.17% |
| Maximum | 31.5% | 37.5% |
| Range | 28.9% | 37.3% |
| Mean | 12.4% | 12.6% |
| Median | 11.8% | 12.0% |
| Interquartile 25% (IQ1) | 9.8% | 7.9% |
| Interquartile 75% (IQ3) | 13.8% | 14.2% |
| Interquartile Range (IQR) | 4.0% | 6.3% |
| Standard Deviation (Sample) | 5.0% | 7.0% |
| Standard Deviation (Population) | 4.9% | 6.9% |
Similar Demographics by Seniors Poverty Over the Age of 75
Demographics Similar to Immigrants from Burma/Myanmar by Seniors Poverty Over the Age of 75
In terms of seniors poverty over the age of 75, the demographic groups most similar to Immigrants from Burma/Myanmar are Indonesian (12.1%, a difference of 0.020%), Immigrants from Sudan (12.1%, a difference of 0.060%), Portuguese (12.1%, a difference of 0.090%), Immigrants from Middle Africa (12.1%, a difference of 0.10%), and Immigrants from Eastern Africa (12.1%, a difference of 0.13%).
| Demographics | Rating | Rank | Seniors Poverty Over the Age of 75 |
| Asians | 67.4 /100 | #149 | Good 12.0% |
| Cypriots | 67.3 /100 | #150 | Good 12.0% |
| Cherokee | 65.8 /100 | #151 | Good 12.0% |
| Immigrants | Korea | 65.5 /100 | #152 | Good 12.0% |
| Immigrants | Turkey | 64.7 /100 | #153 | Good 12.0% |
| Cambodians | 64.0 /100 | #154 | Good 12.0% |
| Indonesians | 62.6 /100 | #155 | Good 12.1% |
| Immigrants | Burma/Myanmar | 62.3 /100 | #156 | Good 12.1% |
| Immigrants | Sudan | 61.7 /100 | #157 | Good 12.1% |
| Portuguese | 61.3 /100 | #158 | Good 12.1% |
| Immigrants | Middle Africa | 61.2 /100 | #159 | Good 12.1% |
| Immigrants | Eastern Africa | 60.9 /100 | #160 | Good 12.1% |
| Immigrants | Norway | 60.6 /100 | #161 | Good 12.1% |
| Immigrants | Serbia | 60.2 /100 | #162 | Good 12.1% |
| Immigrants | Greece | 58.2 /100 | #163 | Average 12.1% |
Demographics Similar to Costa Ricans by Seniors Poverty Over the Age of 75
In terms of seniors poverty over the age of 75, the demographic groups most similar to Costa Ricans are Immigrants from Eastern Asia (12.8%, a difference of 0.080%), Albanian (12.7%, a difference of 0.20%), Indian (Asian) (12.7%, a difference of 0.24%), Immigrants from Liberia (12.8%, a difference of 0.36%), and Immigrants from Eritrea (12.7%, a difference of 0.40%).
| Demographics | Rating | Rank | Seniors Poverty Over the Age of 75 |
| Immigrants | Vietnam | 12.1 /100 | #200 | Poor 12.7% |
| Paraguayans | 11.1 /100 | #201 | Poor 12.7% |
| Arapaho | 10.9 /100 | #202 | Poor 12.7% |
| Immigrants | Southern Europe | 10.7 /100 | #203 | Poor 12.7% |
| Immigrants | Eritrea | 10.5 /100 | #204 | Poor 12.7% |
| Indians (Asian) | 9.7 /100 | #205 | Tragic 12.7% |
| Albanians | 9.6 /100 | #206 | Tragic 12.7% |
| Costa Ricans | 8.7 /100 | #207 | Tragic 12.8% |
| Immigrants | Eastern Asia | 8.4 /100 | #208 | Tragic 12.8% |
| Immigrants | Liberia | 7.3 /100 | #209 | Tragic 12.8% |
| Comanche | 7.0 /100 | #210 | Tragic 12.8% |
| Brazilians | 6.9 /100 | #211 | Tragic 12.8% |
| Immigrants | Hong Kong | 6.5 /100 | #212 | Tragic 12.8% |
| French American Indians | 6.1 /100 | #213 | Tragic 12.9% |
| Immigrants | Africa | 5.9 /100 | #214 | Tragic 12.9% |