Immigrants from Europe vs German Russian Seniors Poverty Over the Age of 75
COMPARE
Immigrants from Europe
German Russian
Seniors Poverty Over the Age of 75
Seniors Poverty Over the Age of 75 Comparison
Immigrants from Europe
German Russians
12.2%
SENIORS POVERTY OVER THE AGE OF 75
50.0/ 100
METRIC RATING
174th/ 347
METRIC RANK
12.3%
SENIORS POVERTY OVER THE AGE OF 75
41.4/ 100
METRIC RATING
182nd/ 347
METRIC RANK
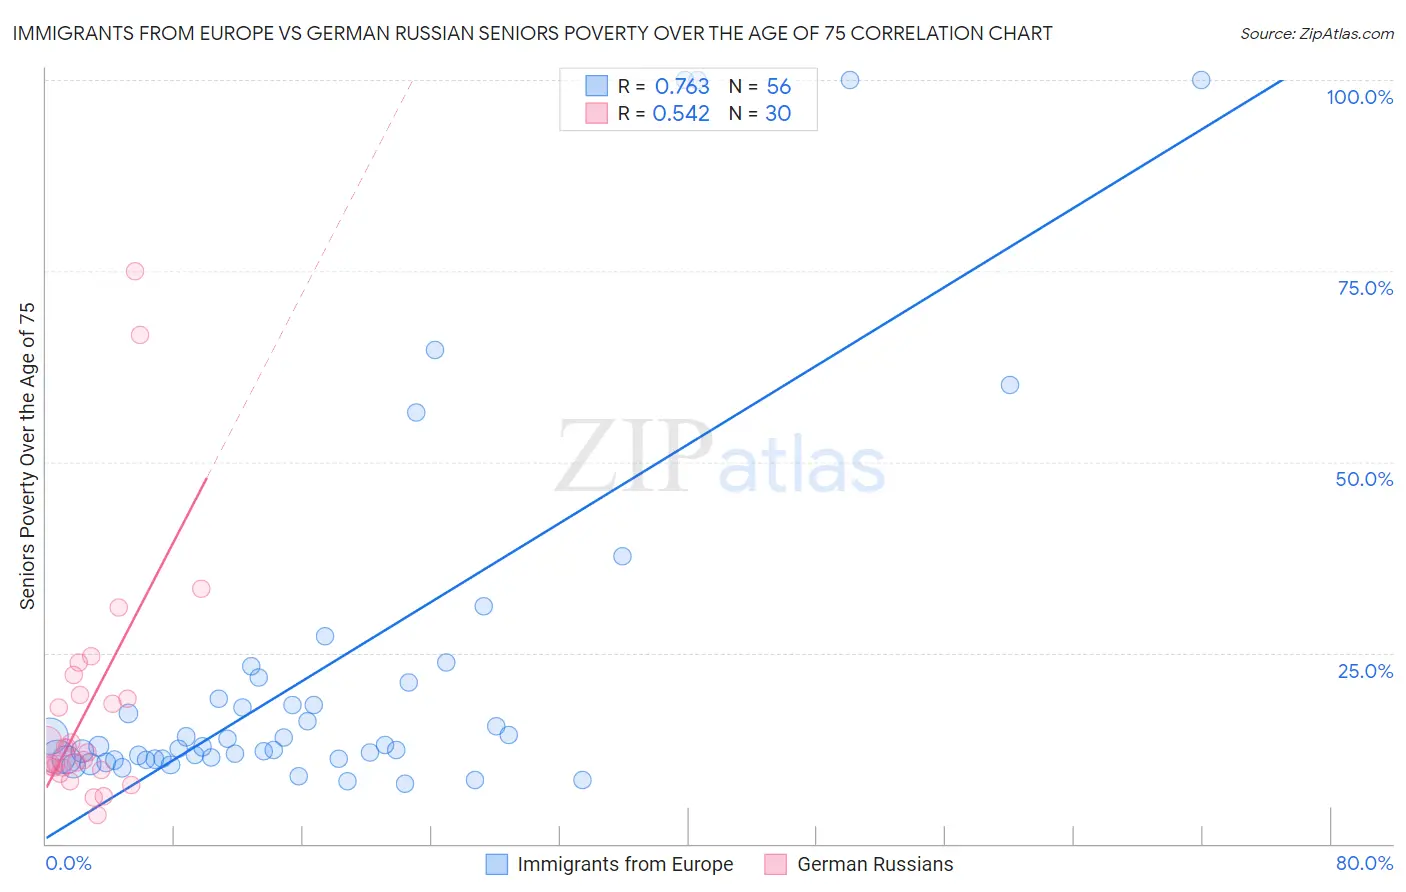
Immigrants from Europe vs German Russian Seniors Poverty Over the Age of 75 Correlation Chart
The statistical analysis conducted on geographies consisting of 534,137,769 people shows a strong positive correlation between the proportion of Immigrants from Europe and poverty level among seniors over the age of 75 in the United States with a correlation coefficient (R) of 0.763 and weighted average of 12.2%. Similarly, the statistical analysis conducted on geographies consisting of 96,005,724 people shows a substantial positive correlation between the proportion of German Russians and poverty level among seniors over the age of 75 in the United States with a correlation coefficient (R) of 0.542 and weighted average of 12.3%, a difference of 0.70%.
Seniors Poverty Over the Age of 75 Correlation Summary
| Measurement | Immigrants from Europe | German Russian |
| Minimum | 7.9% | 3.8% |
| Maximum | 100.0% | 75.0% |
| Range | 92.1% | 71.2% |
| Mean | 23.0% | 17.9% |
| Median | 12.7% | 12.2% |
| Interquartile 25% (IQ1) | 11.1% | 9.9% |
| Interquartile 75% (IQ3) | 20.0% | 19.4% |
| Interquartile Range (IQR) | 8.9% | 9.5% |
| Standard Deviation (Sample) | 24.6% | 16.1% |
| Standard Deviation (Population) | 24.4% | 15.8% |
Demographics Similar to Immigrants from Europe and German Russians by Seniors Poverty Over the Age of 75
In terms of seniors poverty over the age of 75, the demographic groups most similar to Immigrants from Europe are Arab (12.2%, a difference of 0.040%), Immigrants from Saudi Arabia (12.2%, a difference of 0.040%), Immigrants from Fiji (12.2%, a difference of 0.12%), Spaniard (12.2%, a difference of 0.13%), and Immigrants from Thailand (12.2%, a difference of 0.16%). Similarly, the demographic groups most similar to German Russians are Immigrants from Australia (12.2%, a difference of 0.23%), Immigrants from South Eastern Asia (12.2%, a difference of 0.24%), Laotian (12.3%, a difference of 0.27%), Mongolian (12.2%, a difference of 0.34%), and Nonimmigrants (12.2%, a difference of 0.45%).
| Demographics | Rating | Rank | Seniors Poverty Over the Age of 75 |
| Immigrants | Syria | 53.9 /100 | #168 | Average 12.2% |
| Immigrants | Egypt | 53.7 /100 | #169 | Average 12.2% |
| Immigrants | Thailand | 52.0 /100 | #170 | Average 12.2% |
| Spaniards | 51.6 /100 | #171 | Average 12.2% |
| Immigrants | Fiji | 51.5 /100 | #172 | Average 12.2% |
| Arabs | 50.5 /100 | #173 | Average 12.2% |
| Immigrants | Europe | 50.0 /100 | #174 | Average 12.2% |
| Immigrants | Saudi Arabia | 49.5 /100 | #175 | Average 12.2% |
| Immigrants | Iran | 48.1 /100 | #176 | Average 12.2% |
| Immigrants | Asia | 47.8 /100 | #177 | Average 12.2% |
| Immigrants | Nonimmigrants | 46.8 /100 | #178 | Average 12.2% |
| Mongolians | 45.5 /100 | #179 | Average 12.2% |
| Immigrants | South Eastern Asia | 44.3 /100 | #180 | Average 12.2% |
| Immigrants | Australia | 44.2 /100 | #181 | Average 12.2% |
| German Russians | 41.4 /100 | #182 | Average 12.3% |
| Laotians | 38.2 /100 | #183 | Fair 12.3% |
| Kiowa | 36.0 /100 | #184 | Fair 12.3% |
| Immigrants | Malaysia | 35.8 /100 | #185 | Fair 12.3% |
| Sri Lankans | 32.3 /100 | #186 | Fair 12.4% |
| Yaqui | 25.9 /100 | #187 | Fair 12.5% |
| Immigrants | Northern Africa | 25.2 /100 | #188 | Fair 12.5% |