Immigrants from Argentina vs German Russian Seniors Poverty Over the Age of 75
COMPARE
Immigrants from Argentina
German Russian
Seniors Poverty Over the Age of 75
Seniors Poverty Over the Age of 75 Comparison
Immigrants from Argentina
German Russians
13.7%
SENIORS POVERTY OVER THE AGE OF 75
0.3/ 100
METRIC RATING
252nd/ 347
METRIC RANK
12.3%
SENIORS POVERTY OVER THE AGE OF 75
41.4/ 100
METRIC RATING
182nd/ 347
METRIC RANK
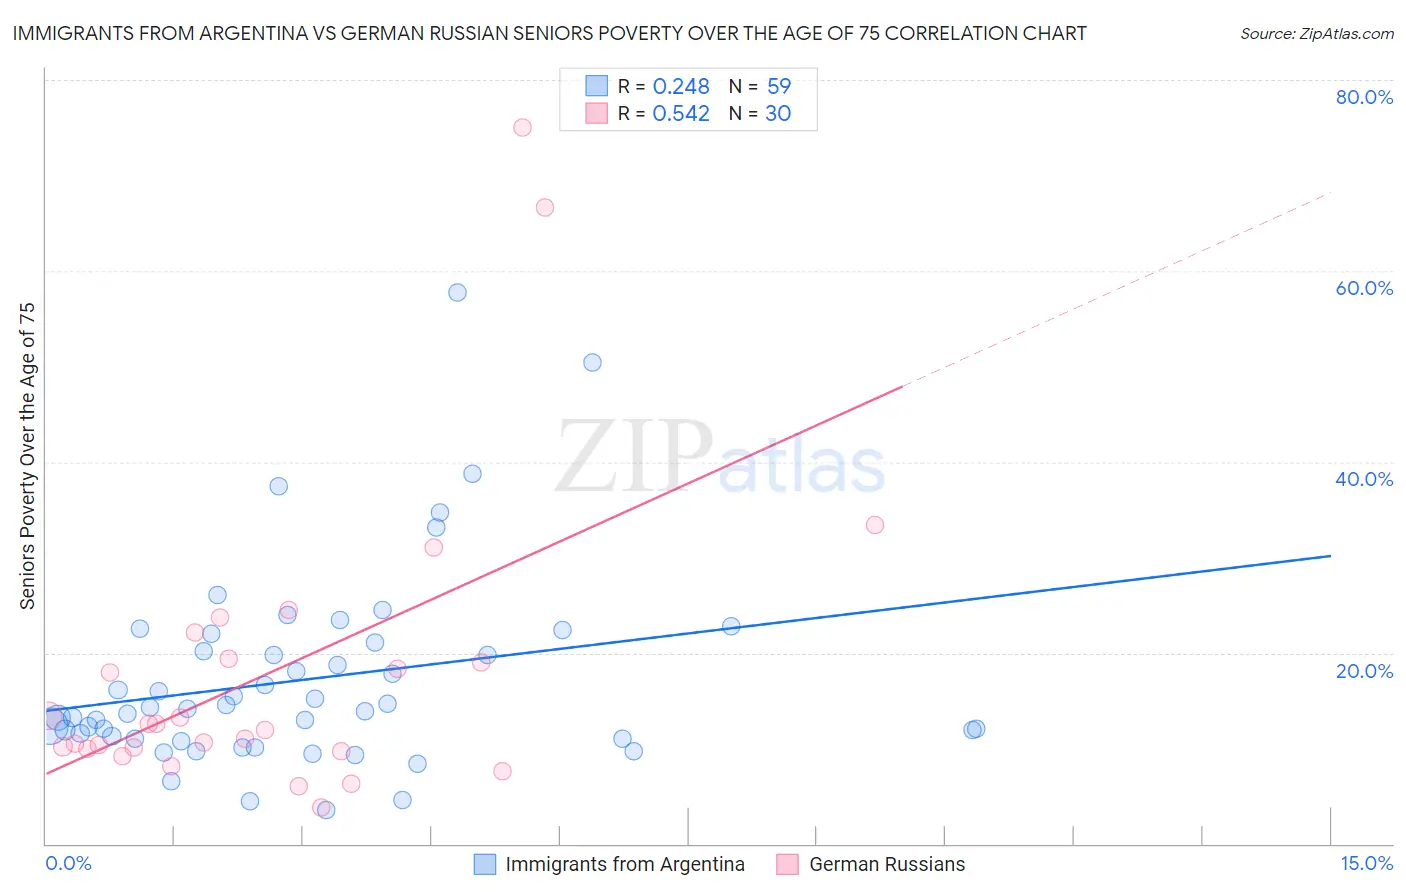
Immigrants from Argentina vs German Russian Seniors Poverty Over the Age of 75 Correlation Chart
The statistical analysis conducted on geographies consisting of 262,394,450 people shows a weak positive correlation between the proportion of Immigrants from Argentina and poverty level among seniors over the age of 75 in the United States with a correlation coefficient (R) of 0.248 and weighted average of 13.7%. Similarly, the statistical analysis conducted on geographies consisting of 96,005,724 people shows a substantial positive correlation between the proportion of German Russians and poverty level among seniors over the age of 75 in the United States with a correlation coefficient (R) of 0.542 and weighted average of 12.3%, a difference of 11.3%.
Seniors Poverty Over the Age of 75 Correlation Summary
| Measurement | Immigrants from Argentina | German Russian |
| Minimum | 3.5% | 3.8% |
| Maximum | 57.7% | 75.0% |
| Range | 54.2% | 71.2% |
| Mean | 17.2% | 17.9% |
| Median | 14.2% | 12.2% |
| Interquartile 25% (IQ1) | 11.0% | 9.9% |
| Interquartile 75% (IQ3) | 21.1% | 19.4% |
| Interquartile Range (IQR) | 10.0% | 9.5% |
| Standard Deviation (Sample) | 10.3% | 16.1% |
| Standard Deviation (Population) | 10.2% | 15.8% |
Similar Demographics by Seniors Poverty Over the Age of 75
Demographics Similar to Immigrants from Argentina by Seniors Poverty Over the Age of 75
In terms of seniors poverty over the age of 75, the demographic groups most similar to Immigrants from Argentina are Immigrants from Peru (13.7%, a difference of 0.050%), Immigrants from Spain (13.7%, a difference of 0.22%), Blackfeet (13.7%, a difference of 0.33%), Mexican American Indian (13.6%, a difference of 0.38%), and Immigrants from Albania (13.6%, a difference of 0.39%).
| Demographics | Rating | Rank | Seniors Poverty Over the Age of 75 |
| Uruguayans | 0.5 /100 | #245 | Tragic 13.5% |
| Immigrants | Cambodia | 0.4 /100 | #246 | Tragic 13.6% |
| Immigrants | Ukraine | 0.3 /100 | #247 | Tragic 13.6% |
| Africans | 0.3 /100 | #248 | Tragic 13.6% |
| Immigrants | Albania | 0.3 /100 | #249 | Tragic 13.6% |
| Mexican American Indians | 0.3 /100 | #250 | Tragic 13.6% |
| Immigrants | Peru | 0.3 /100 | #251 | Tragic 13.7% |
| Immigrants | Argentina | 0.3 /100 | #252 | Tragic 13.7% |
| Immigrants | Spain | 0.2 /100 | #253 | Tragic 13.7% |
| Blackfeet | 0.2 /100 | #254 | Tragic 13.7% |
| Immigrants | Belarus | 0.2 /100 | #255 | Tragic 13.8% |
| Inupiat | 0.1 /100 | #256 | Tragic 13.8% |
| Immigrants | Western Africa | 0.1 /100 | #257 | Tragic 13.9% |
| Immigrants | Panama | 0.1 /100 | #258 | Tragic 13.9% |
| Immigrants | Portugal | 0.1 /100 | #259 | Tragic 13.9% |
Demographics Similar to German Russians by Seniors Poverty Over the Age of 75
In terms of seniors poverty over the age of 75, the demographic groups most similar to German Russians are Immigrants from Australia (12.2%, a difference of 0.23%), Immigrants from South Eastern Asia (12.2%, a difference of 0.24%), Laotian (12.3%, a difference of 0.27%), Mongolian (12.2%, a difference of 0.34%), and Nonimmigrants (12.2%, a difference of 0.45%).
| Demographics | Rating | Rank | Seniors Poverty Over the Age of 75 |
| Immigrants | Saudi Arabia | 49.5 /100 | #175 | Average 12.2% |
| Immigrants | Iran | 48.1 /100 | #176 | Average 12.2% |
| Immigrants | Asia | 47.8 /100 | #177 | Average 12.2% |
| Immigrants | Nonimmigrants | 46.8 /100 | #178 | Average 12.2% |
| Mongolians | 45.5 /100 | #179 | Average 12.2% |
| Immigrants | South Eastern Asia | 44.3 /100 | #180 | Average 12.2% |
| Immigrants | Australia | 44.2 /100 | #181 | Average 12.2% |
| German Russians | 41.4 /100 | #182 | Average 12.3% |
| Laotians | 38.2 /100 | #183 | Fair 12.3% |
| Kiowa | 36.0 /100 | #184 | Fair 12.3% |
| Immigrants | Malaysia | 35.8 /100 | #185 | Fair 12.3% |
| Sri Lankans | 32.3 /100 | #186 | Fair 12.4% |
| Yaqui | 25.9 /100 | #187 | Fair 12.5% |
| Immigrants | Northern Africa | 25.2 /100 | #188 | Fair 12.5% |
| Immigrants | Indonesia | 24.4 /100 | #189 | Fair 12.5% |