Immigrants from Bulgaria vs Jordanian Births to Unmarried Women
COMPARE
Immigrants from Bulgaria
Jordanian
Births to Unmarried Women
Births to Unmarried Women Comparison
Immigrants from Bulgaria
Jordanians
27.6%
BIRTHS TO UNMARRIED WOMEN
99.6/ 100
METRIC RATING
43rd/ 347
METRIC RANK
28.5%
BIRTHS TO UNMARRIED WOMEN
98.5/ 100
METRIC RATING
71st/ 347
METRIC RANK
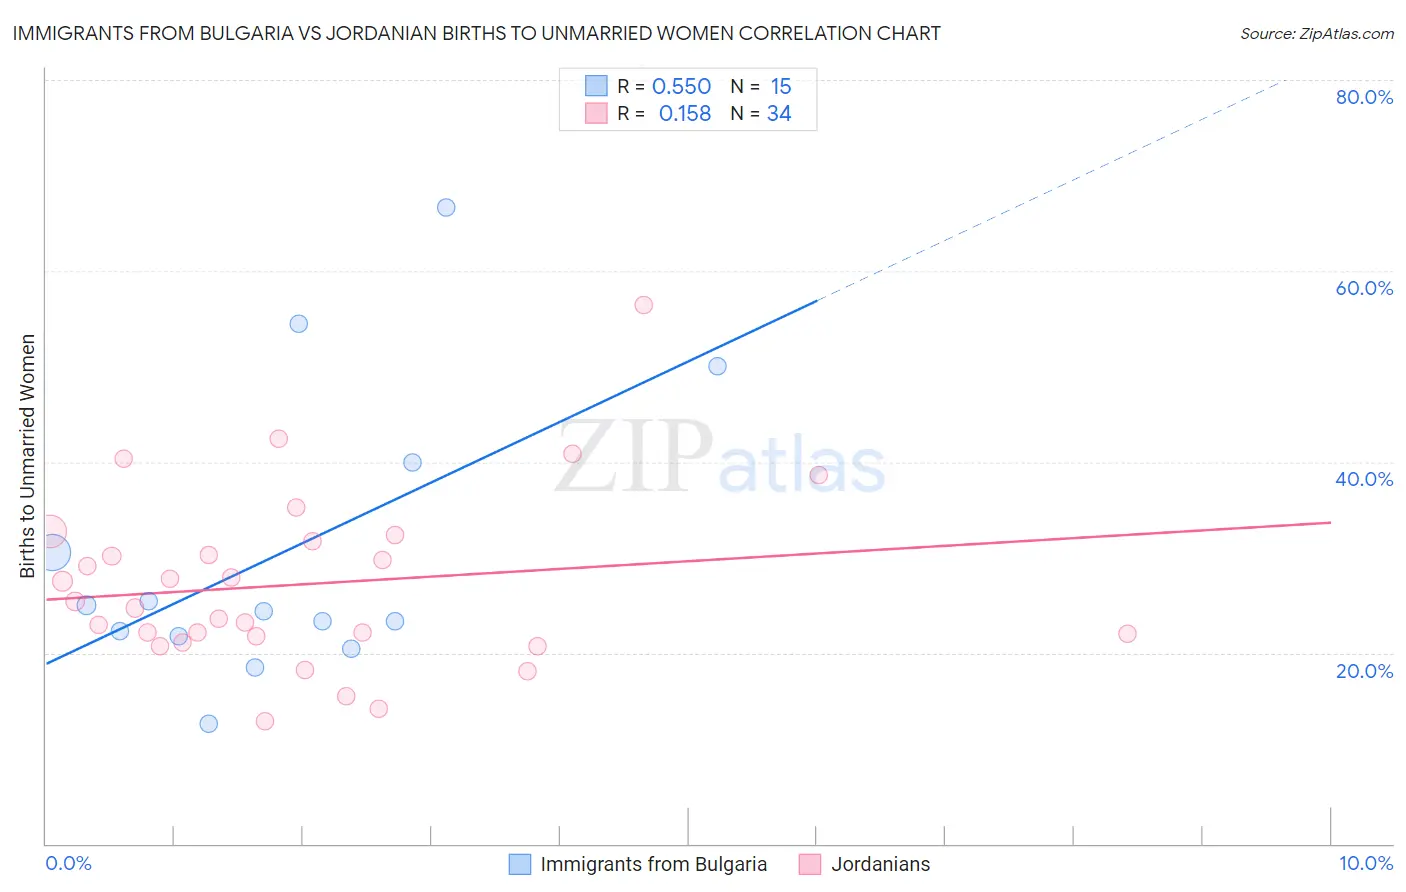
Immigrants from Bulgaria vs Jordanian Births to Unmarried Women Correlation Chart
The statistical analysis conducted on geographies consisting of 164,531,570 people shows a substantial positive correlation between the proportion of Immigrants from Bulgaria and percentage of births to unmarried women in the United States with a correlation coefficient (R) of 0.550 and weighted average of 27.6%. Similarly, the statistical analysis conducted on geographies consisting of 160,910,775 people shows a poor positive correlation between the proportion of Jordanians and percentage of births to unmarried women in the United States with a correlation coefficient (R) of 0.158 and weighted average of 28.5%, a difference of 3.2%.
Births to Unmarried Women Correlation Summary
| Measurement | Immigrants from Bulgaria | Jordanian |
| Minimum | 12.6% | 12.8% |
| Maximum | 66.7% | 56.4% |
| Range | 54.1% | 43.6% |
| Mean | 30.6% | 27.2% |
| Median | 24.4% | 25.0% |
| Interquartile 25% (IQ1) | 21.8% | 21.7% |
| Interquartile 75% (IQ3) | 40.0% | 31.7% |
| Interquartile Range (IQR) | 18.2% | 10.0% |
| Standard Deviation (Sample) | 15.3% | 9.1% |
| Standard Deviation (Population) | 14.8% | 9.0% |
Similar Demographics by Births to Unmarried Women
Demographics Similar to Immigrants from Bulgaria by Births to Unmarried Women
In terms of births to unmarried women, the demographic groups most similar to Immigrants from Bulgaria are Immigrants from Eastern Europe (27.6%, a difference of 0.23%), Iraqi (27.6%, a difference of 0.24%), Immigrants from Indonesia (27.7%, a difference of 0.26%), Latvian (27.7%, a difference of 0.36%), and Immigrants from Lithuania (27.7%, a difference of 0.40%).
| Demographics | Rating | Rank | Births to Unmarried Women |
| Immigrants | Western Asia | 99.7 /100 | #36 | Exceptional 27.2% |
| Immigrants | Ukraine | 99.7 /100 | #37 | Exceptional 27.2% |
| Immigrants | Moldova | 99.7 /100 | #38 | Exceptional 27.3% |
| Immigrants | Malaysia | 99.7 /100 | #39 | Exceptional 27.4% |
| Turks | 99.6 /100 | #40 | Exceptional 27.4% |
| Iraqis | 99.6 /100 | #41 | Exceptional 27.6% |
| Immigrants | Eastern Europe | 99.6 /100 | #42 | Exceptional 27.6% |
| Immigrants | Bulgaria | 99.6 /100 | #43 | Exceptional 27.6% |
| Immigrants | Indonesia | 99.5 /100 | #44 | Exceptional 27.7% |
| Latvians | 99.5 /100 | #45 | Exceptional 27.7% |
| Immigrants | Lithuania | 99.5 /100 | #46 | Exceptional 27.7% |
| Hmong | 99.5 /100 | #47 | Exceptional 27.7% |
| Eastern Europeans | 99.5 /100 | #48 | Exceptional 27.7% |
| Immigrants | Greece | 99.4 /100 | #49 | Exceptional 27.8% |
| Maltese | 99.4 /100 | #50 | Exceptional 27.8% |
Demographics Similar to Jordanians by Births to Unmarried Women
In terms of births to unmarried women, the demographic groups most similar to Jordanians are Immigrants from Sweden (28.5%, a difference of 0.060%), Albanian (28.5%, a difference of 0.11%), Immigrants from Bolivia (28.6%, a difference of 0.13%), Laotian (28.5%, a difference of 0.18%), and Immigrants from Switzerland (28.6%, a difference of 0.22%).
| Demographics | Rating | Rank | Births to Unmarried Women |
| Tongans | 98.8 /100 | #64 | Exceptional 28.4% |
| Immigrants | Czechoslovakia | 98.8 /100 | #65 | Exceptional 28.4% |
| Immigrants | Egypt | 98.8 /100 | #66 | Exceptional 28.4% |
| Palestinians | 98.7 /100 | #67 | Exceptional 28.4% |
| Immigrants | Europe | 98.7 /100 | #68 | Exceptional 28.4% |
| Bolivians | 98.7 /100 | #69 | Exceptional 28.5% |
| Laotians | 98.6 /100 | #70 | Exceptional 28.5% |
| Jordanians | 98.5 /100 | #71 | Exceptional 28.5% |
| Immigrants | Sweden | 98.5 /100 | #72 | Exceptional 28.5% |
| Albanians | 98.5 /100 | #73 | Exceptional 28.5% |
| Immigrants | Bolivia | 98.5 /100 | #74 | Exceptional 28.6% |
| Immigrants | Switzerland | 98.4 /100 | #75 | Exceptional 28.6% |
| Israelis | 98.4 /100 | #76 | Exceptional 28.6% |
| Immigrants | Northern Europe | 98.3 /100 | #77 | Exceptional 28.6% |
| Zimbabweans | 98.2 /100 | #78 | Exceptional 28.7% |