Immigrants from Brazil vs Spanish American Indian Child Poverty Under the Age of 16
COMPARE
Immigrants from Brazil
Spanish American Indian
Child Poverty Under the Age of 16
Child Poverty Under the Age of 16 Comparison
Immigrants from Brazil
Spanish American Indians
15.1%
CHILD POVERTY UNDER THE AGE OF 16
91.1/ 100
METRIC RATING
123rd/ 347
METRIC RANK
19.7%
CHILD POVERTY UNDER THE AGE OF 16
0.1/ 100
METRIC RATING
270th/ 347
METRIC RANK
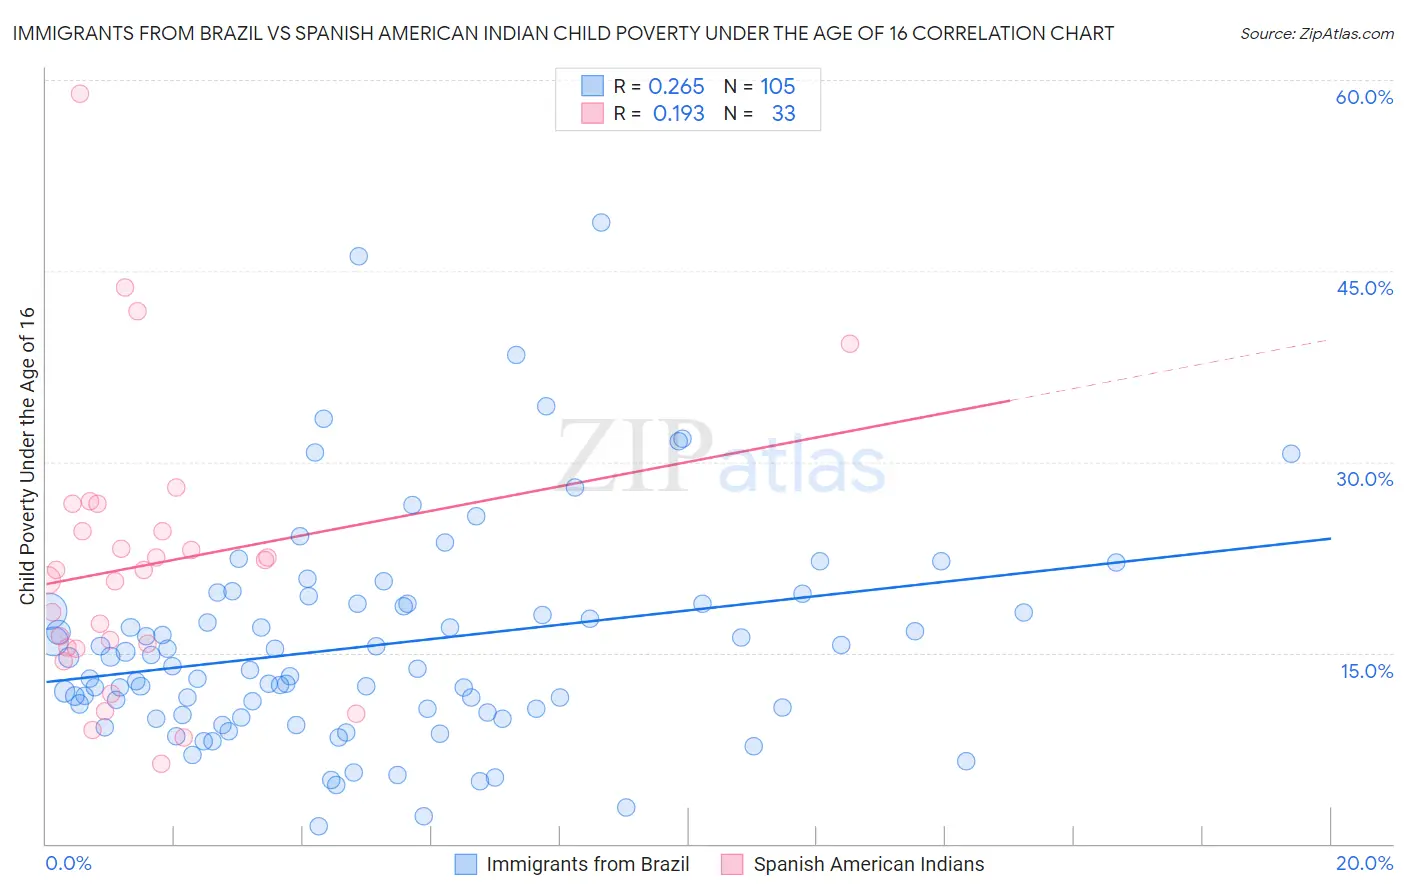
Immigrants from Brazil vs Spanish American Indian Child Poverty Under the Age of 16 Correlation Chart
The statistical analysis conducted on geographies consisting of 340,154,943 people shows a weak positive correlation between the proportion of Immigrants from Brazil and poverty level among children under the age of 16 in the United States with a correlation coefficient (R) of 0.265 and weighted average of 15.1%. Similarly, the statistical analysis conducted on geographies consisting of 73,047,065 people shows a poor positive correlation between the proportion of Spanish American Indians and poverty level among children under the age of 16 in the United States with a correlation coefficient (R) of 0.193 and weighted average of 19.7%, a difference of 30.6%.
Child Poverty Under the Age of 16 Correlation Summary
| Measurement | Immigrants from Brazil | Spanish American Indian |
| Minimum | 1.4% | 6.3% |
| Maximum | 48.8% | 58.9% |
| Range | 47.4% | 52.6% |
| Mean | 15.6% | 21.9% |
| Median | 13.7% | 21.5% |
| Interquartile 25% (IQ1) | 10.2% | 15.4% |
| Interquartile 75% (IQ3) | 18.8% | 25.6% |
| Interquartile Range (IQR) | 8.6% | 10.3% |
| Standard Deviation (Sample) | 8.5% | 11.1% |
| Standard Deviation (Population) | 8.5% | 10.9% |
Similar Demographics by Child Poverty Under the Age of 16
Demographics Similar to Immigrants from Brazil by Child Poverty Under the Age of 16
In terms of child poverty under the age of 16, the demographic groups most similar to Immigrants from Brazil are Czechoslovakian (15.1%, a difference of 0.0%), Palestinian (15.1%, a difference of 0.040%), Portuguese (15.1%, a difference of 0.19%), Pakistani (15.0%, a difference of 0.24%), and Immigrants from Western Europe (15.1%, a difference of 0.28%).
| Demographics | Rating | Rank | Child Poverty Under the Age of 16 |
| Carpatho Rusyns | 93.1 /100 | #116 | Exceptional 14.9% |
| Immigrants | Norway | 92.8 /100 | #117 | Exceptional 15.0% |
| Immigrants | Malaysia | 92.6 /100 | #118 | Exceptional 15.0% |
| Scottish | 92.3 /100 | #119 | Exceptional 15.0% |
| South Africans | 92.1 /100 | #120 | Exceptional 15.0% |
| Immigrants | Zimbabwe | 92.1 /100 | #121 | Exceptional 15.0% |
| Pakistanis | 91.7 /100 | #122 | Exceptional 15.0% |
| Immigrants | Brazil | 91.1 /100 | #123 | Exceptional 15.1% |
| Czechoslovakians | 91.0 /100 | #124 | Exceptional 15.1% |
| Palestinians | 90.9 /100 | #125 | Exceptional 15.1% |
| Portuguese | 90.6 /100 | #126 | Exceptional 15.1% |
| Immigrants | Western Europe | 90.3 /100 | #127 | Exceptional 15.1% |
| Immigrants | Kazakhstan | 90.2 /100 | #128 | Exceptional 15.1% |
| Immigrants | Southern Europe | 89.7 /100 | #129 | Excellent 15.1% |
| Mongolians | 89.5 /100 | #130 | Excellent 15.2% |
Demographics Similar to Spanish American Indians by Child Poverty Under the Age of 16
In terms of child poverty under the age of 16, the demographic groups most similar to Spanish American Indians are Immigrants from El Salvador (19.7%, a difference of 0.020%), Jamaican (19.7%, a difference of 0.080%), Immigrants from Liberia (19.7%, a difference of 0.13%), Immigrants from Bangladesh (19.8%, a difference of 0.43%), and Immigrants from Jamaica (19.8%, a difference of 0.67%).
| Demographics | Rating | Rank | Child Poverty Under the Age of 16 |
| Vietnamese | 0.1 /100 | #263 | Tragic 19.4% |
| Immigrants | Ecuador | 0.1 /100 | #264 | Tragic 19.4% |
| Chickasaw | 0.1 /100 | #265 | Tragic 19.5% |
| Liberians | 0.1 /100 | #266 | Tragic 19.5% |
| Cherokee | 0.1 /100 | #267 | Tragic 19.5% |
| Jamaicans | 0.1 /100 | #268 | Tragic 19.7% |
| Immigrants | El Salvador | 0.1 /100 | #269 | Tragic 19.7% |
| Spanish American Indians | 0.1 /100 | #270 | Tragic 19.7% |
| Immigrants | Liberia | 0.1 /100 | #271 | Tragic 19.7% |
| Immigrants | Bangladesh | 0.1 /100 | #272 | Tragic 19.8% |
| Immigrants | Jamaica | 0.1 /100 | #273 | Tragic 19.8% |
| Immigrants | Cabo Verde | 0.1 /100 | #274 | Tragic 19.9% |
| Immigrants | Barbados | 0.1 /100 | #275 | Tragic 19.9% |
| Belizeans | 0.1 /100 | #276 | Tragic 19.9% |
| Iroquois | 0.1 /100 | #277 | Tragic 19.9% |