Immigrants from England vs Spanish American Indian Child Poverty Under the Age of 16
COMPARE
Immigrants from England
Spanish American Indian
Child Poverty Under the Age of 16
Child Poverty Under the Age of 16 Comparison
Immigrants from England
Spanish American Indians
14.8%
CHILD POVERTY UNDER THE AGE OF 16
94.8/ 100
METRIC RATING
104th/ 347
METRIC RANK
19.7%
CHILD POVERTY UNDER THE AGE OF 16
0.1/ 100
METRIC RATING
270th/ 347
METRIC RANK
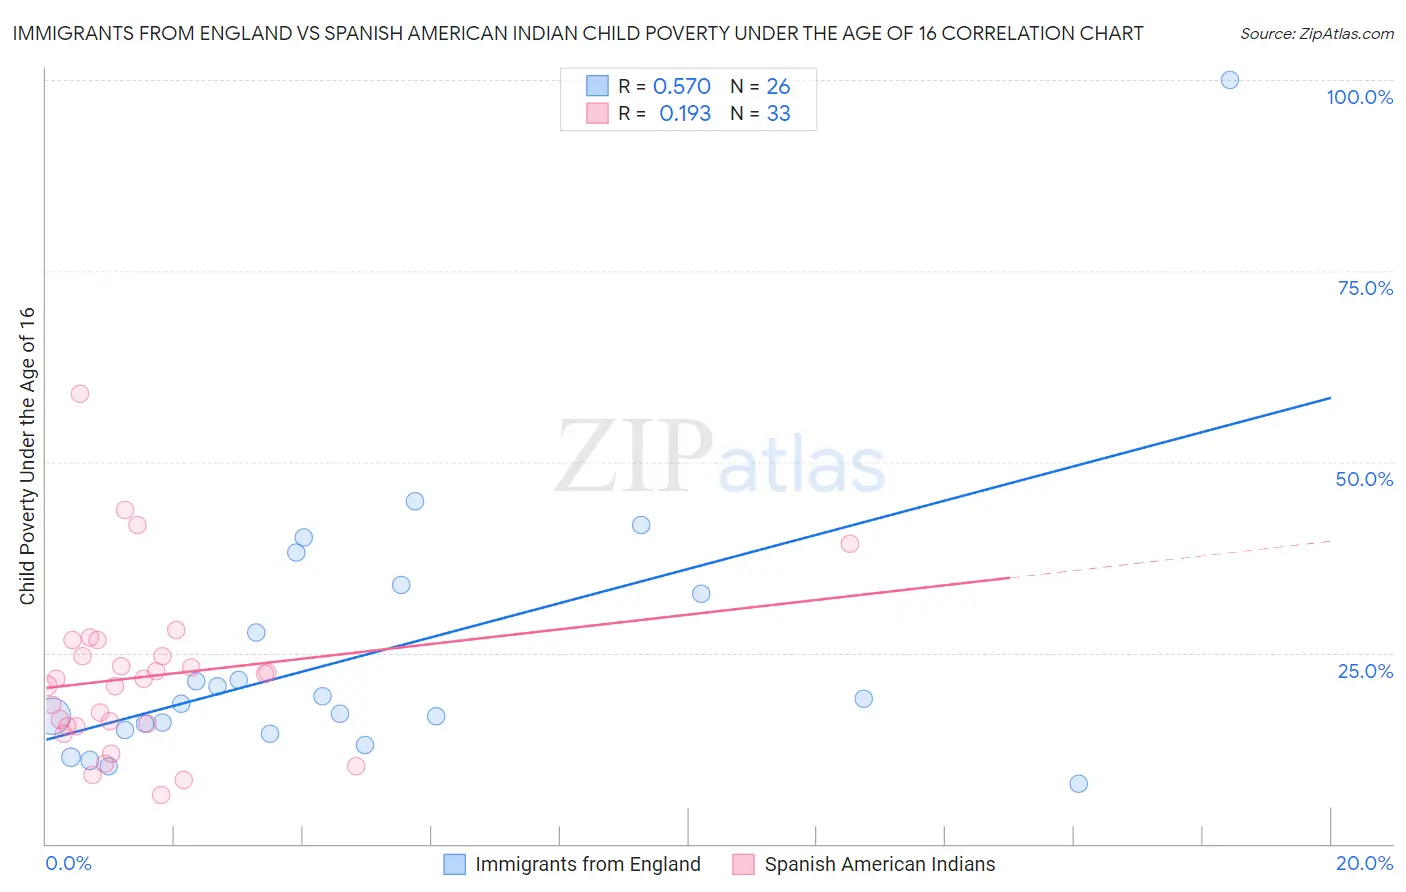
Immigrants from England vs Spanish American Indian Child Poverty Under the Age of 16 Correlation Chart
The statistical analysis conducted on geographies consisting of 387,672,551 people shows a substantial positive correlation between the proportion of Immigrants from England and poverty level among children under the age of 16 in the United States with a correlation coefficient (R) of 0.570 and weighted average of 14.8%. Similarly, the statistical analysis conducted on geographies consisting of 73,047,065 people shows a poor positive correlation between the proportion of Spanish American Indians and poverty level among children under the age of 16 in the United States with a correlation coefficient (R) of 0.193 and weighted average of 19.7%, a difference of 33.1%.
Child Poverty Under the Age of 16 Correlation Summary
| Measurement | Immigrants from England | Spanish American Indian |
| Minimum | 7.8% | 6.3% |
| Maximum | 100.0% | 58.9% |
| Range | 92.2% | 52.6% |
| Mean | 24.7% | 21.9% |
| Median | 18.6% | 21.5% |
| Interquartile 25% (IQ1) | 14.9% | 15.4% |
| Interquartile 75% (IQ3) | 32.7% | 25.6% |
| Interquartile Range (IQR) | 17.8% | 10.3% |
| Standard Deviation (Sample) | 18.6% | 11.1% |
| Standard Deviation (Population) | 18.2% | 10.9% |
Similar Demographics by Child Poverty Under the Age of 16
Demographics Similar to Immigrants from England by Child Poverty Under the Age of 16
In terms of child poverty under the age of 16, the demographic groups most similar to Immigrants from England are Immigrants from Egypt (14.8%, a difference of 0.040%), Romanian (14.8%, a difference of 0.090%), Basque (14.8%, a difference of 0.11%), Immigrants from Switzerland (14.8%, a difference of 0.16%), and Dutch (14.8%, a difference of 0.17%).
| Demographics | Rating | Rank | Child Poverty Under the Age of 16 |
| Paraguayans | 95.7 /100 | #97 | Exceptional 14.7% |
| Immigrants | Belarus | 95.7 /100 | #98 | Exceptional 14.7% |
| British | 95.5 /100 | #99 | Exceptional 14.7% |
| Dutch | 95.1 /100 | #100 | Exceptional 14.8% |
| Immigrants | Switzerland | 95.1 /100 | #101 | Exceptional 14.8% |
| Romanians | 95.0 /100 | #102 | Exceptional 14.8% |
| Immigrants | Egypt | 94.9 /100 | #103 | Exceptional 14.8% |
| Immigrants | England | 94.8 /100 | #104 | Exceptional 14.8% |
| Basques | 94.7 /100 | #105 | Exceptional 14.8% |
| Serbians | 94.5 /100 | #106 | Exceptional 14.8% |
| Chileans | 94.4 /100 | #107 | Exceptional 14.8% |
| Jordanians | 94.2 /100 | #108 | Exceptional 14.8% |
| Tlingit-Haida | 94.1 /100 | #109 | Exceptional 14.9% |
| English | 93.5 /100 | #110 | Exceptional 14.9% |
| Immigrants | Denmark | 93.5 /100 | #111 | Exceptional 14.9% |
Demographics Similar to Spanish American Indians by Child Poverty Under the Age of 16
In terms of child poverty under the age of 16, the demographic groups most similar to Spanish American Indians are Immigrants from El Salvador (19.7%, a difference of 0.020%), Jamaican (19.7%, a difference of 0.080%), Immigrants from Liberia (19.7%, a difference of 0.13%), Immigrants from Bangladesh (19.8%, a difference of 0.43%), and Immigrants from Jamaica (19.8%, a difference of 0.67%).
| Demographics | Rating | Rank | Child Poverty Under the Age of 16 |
| Vietnamese | 0.1 /100 | #263 | Tragic 19.4% |
| Immigrants | Ecuador | 0.1 /100 | #264 | Tragic 19.4% |
| Chickasaw | 0.1 /100 | #265 | Tragic 19.5% |
| Liberians | 0.1 /100 | #266 | Tragic 19.5% |
| Cherokee | 0.1 /100 | #267 | Tragic 19.5% |
| Jamaicans | 0.1 /100 | #268 | Tragic 19.7% |
| Immigrants | El Salvador | 0.1 /100 | #269 | Tragic 19.7% |
| Spanish American Indians | 0.1 /100 | #270 | Tragic 19.7% |
| Immigrants | Liberia | 0.1 /100 | #271 | Tragic 19.7% |
| Immigrants | Bangladesh | 0.1 /100 | #272 | Tragic 19.8% |
| Immigrants | Jamaica | 0.1 /100 | #273 | Tragic 19.8% |
| Immigrants | Cabo Verde | 0.1 /100 | #274 | Tragic 19.9% |
| Immigrants | Barbados | 0.1 /100 | #275 | Tragic 19.9% |
| Belizeans | 0.1 /100 | #276 | Tragic 19.9% |
| Iroquois | 0.1 /100 | #277 | Tragic 19.9% |