Immigrants from Brazil vs British West Indian Child Poverty Among Girls Under 16
COMPARE
Immigrants from Brazil
British West Indian
Child Poverty Among Girls Under 16
Child Poverty Among Girls Under 16 Comparison
Immigrants from Brazil
British West Indians
15.1%
CHILD POVERTY AMONG GIRLS UNDER 16
94.9/ 100
METRIC RATING
108th/ 347
METRIC RANK
21.3%
CHILD POVERTY AMONG GIRLS UNDER 16
0.0/ 100
METRIC RATING
303rd/ 347
METRIC RANK
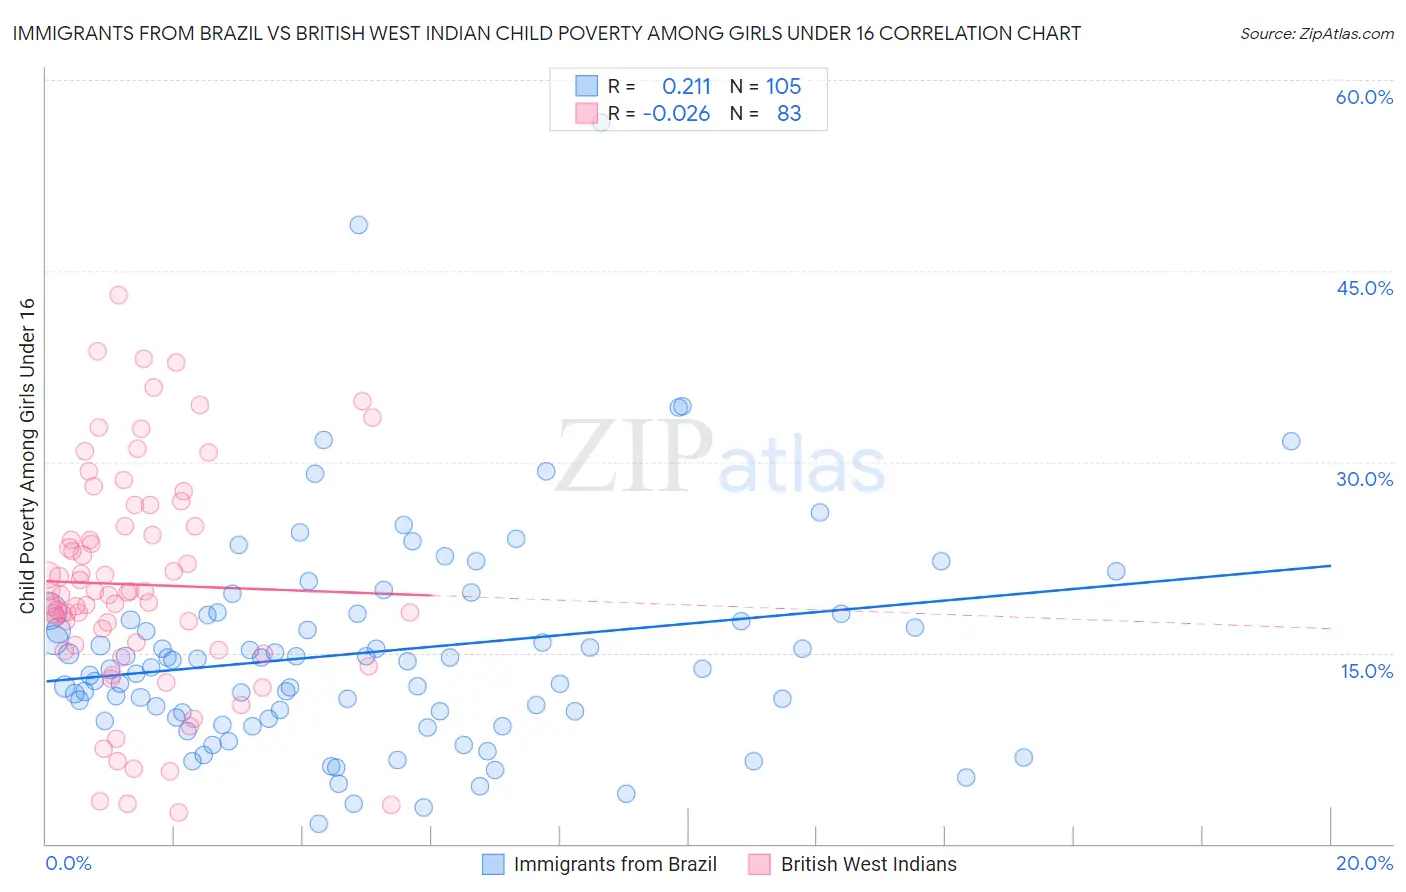
Immigrants from Brazil vs British West Indian Child Poverty Among Girls Under 16 Correlation Chart
The statistical analysis conducted on geographies consisting of 337,270,761 people shows a weak positive correlation between the proportion of Immigrants from Brazil and poverty level among girls under the age of 16 in the United States with a correlation coefficient (R) of 0.211 and weighted average of 15.1%. Similarly, the statistical analysis conducted on geographies consisting of 151,588,382 people shows no correlation between the proportion of British West Indians and poverty level among girls under the age of 16 in the United States with a correlation coefficient (R) of -0.026 and weighted average of 21.3%, a difference of 41.0%.
Child Poverty Among Girls Under 16 Correlation Summary
| Measurement | Immigrants from Brazil | British West Indian |
| Minimum | 1.6% | 2.5% |
| Maximum | 56.7% | 43.1% |
| Range | 55.1% | 40.6% |
| Mean | 15.1% | 20.4% |
| Median | 13.8% | 19.6% |
| Interquartile 25% (IQ1) | 9.9% | 15.2% |
| Interquartile 75% (IQ3) | 18.0% | 25.0% |
| Interquartile Range (IQR) | 8.2% | 9.8% |
| Standard Deviation (Sample) | 8.6% | 8.8% |
| Standard Deviation (Population) | 8.6% | 8.8% |
Similar Demographics by Child Poverty Among Girls Under 16
Demographics Similar to Immigrants from Brazil by Child Poverty Among Girls Under 16
In terms of child poverty among girls under 16, the demographic groups most similar to Immigrants from Brazil are Immigrants from Ukraine (15.1%, a difference of 0.070%), Serbian (15.1%, a difference of 0.080%), Immigrants from England (15.1%, a difference of 0.14%), Chilean (15.1%, a difference of 0.14%), and Immigrants from Croatia (15.1%, a difference of 0.20%).
| Demographics | Rating | Rank | Child Poverty Among Girls Under 16 |
| Immigrants | South Africa | 95.6 /100 | #101 | Exceptional 15.0% |
| Immigrants | Malaysia | 95.6 /100 | #102 | Exceptional 15.0% |
| British | 95.6 /100 | #103 | Exceptional 15.0% |
| Romanians | 95.3 /100 | #104 | Exceptional 15.0% |
| Immigrants | England | 95.1 /100 | #105 | Exceptional 15.1% |
| Chileans | 95.1 /100 | #106 | Exceptional 15.1% |
| Immigrants | Ukraine | 95.0 /100 | #107 | Exceptional 15.1% |
| Immigrants | Brazil | 94.9 /100 | #108 | Exceptional 15.1% |
| Serbians | 94.8 /100 | #109 | Exceptional 15.1% |
| Immigrants | Croatia | 94.6 /100 | #110 | Exceptional 15.1% |
| Palestinians | 94.5 /100 | #111 | Exceptional 15.1% |
| Immigrants | Kazakhstan | 94.3 /100 | #112 | Exceptional 15.1% |
| Dutch | 94.3 /100 | #113 | Exceptional 15.1% |
| Sri Lankans | 94.0 /100 | #114 | Exceptional 15.2% |
| Belgians | 93.9 /100 | #115 | Exceptional 15.2% |
Demographics Similar to British West Indians by Child Poverty Among Girls Under 16
In terms of child poverty among girls under 16, the demographic groups most similar to British West Indians are Indonesian (21.3%, a difference of 0.030%), Seminole (21.2%, a difference of 0.45%), Choctaw (21.1%, a difference of 0.57%), Guatemalan (21.4%, a difference of 0.65%), and Immigrants from Central America (21.4%, a difference of 0.82%).
| Demographics | Rating | Rank | Child Poverty Among Girls Under 16 |
| Immigrants | West Indies | 0.0 /100 | #296 | Tragic 20.7% |
| Inupiat | 0.0 /100 | #297 | Tragic 20.8% |
| Mexicans | 0.0 /100 | #298 | Tragic 20.9% |
| Hispanics or Latinos | 0.0 /100 | #299 | Tragic 21.0% |
| Somalis | 0.0 /100 | #300 | Tragic 21.0% |
| Choctaw | 0.0 /100 | #301 | Tragic 21.1% |
| Seminole | 0.0 /100 | #302 | Tragic 21.2% |
| British West Indians | 0.0 /100 | #303 | Tragic 21.3% |
| Indonesians | 0.0 /100 | #304 | Tragic 21.3% |
| Guatemalans | 0.0 /100 | #305 | Tragic 21.4% |
| Immigrants | Central America | 0.0 /100 | #306 | Tragic 21.4% |
| Immigrants | Bahamas | 0.0 /100 | #307 | Tragic 21.4% |
| Houma | 0.0 /100 | #308 | Tragic 21.5% |
| Bahamians | 0.0 /100 | #309 | Tragic 21.5% |
| Immigrants | Somalia | 0.0 /100 | #310 | Tragic 21.6% |