Immigrants from Fiji vs British West Indian Child Poverty Among Girls Under 16
COMPARE
Immigrants from Fiji
British West Indian
Child Poverty Among Girls Under 16
Child Poverty Among Girls Under 16 Comparison
Immigrants from Fiji
British West Indians
15.9%
CHILD POVERTY AMONG GIRLS UNDER 16
76.1/ 100
METRIC RATING
156th/ 347
METRIC RANK
21.3%
CHILD POVERTY AMONG GIRLS UNDER 16
0.0/ 100
METRIC RATING
303rd/ 347
METRIC RANK
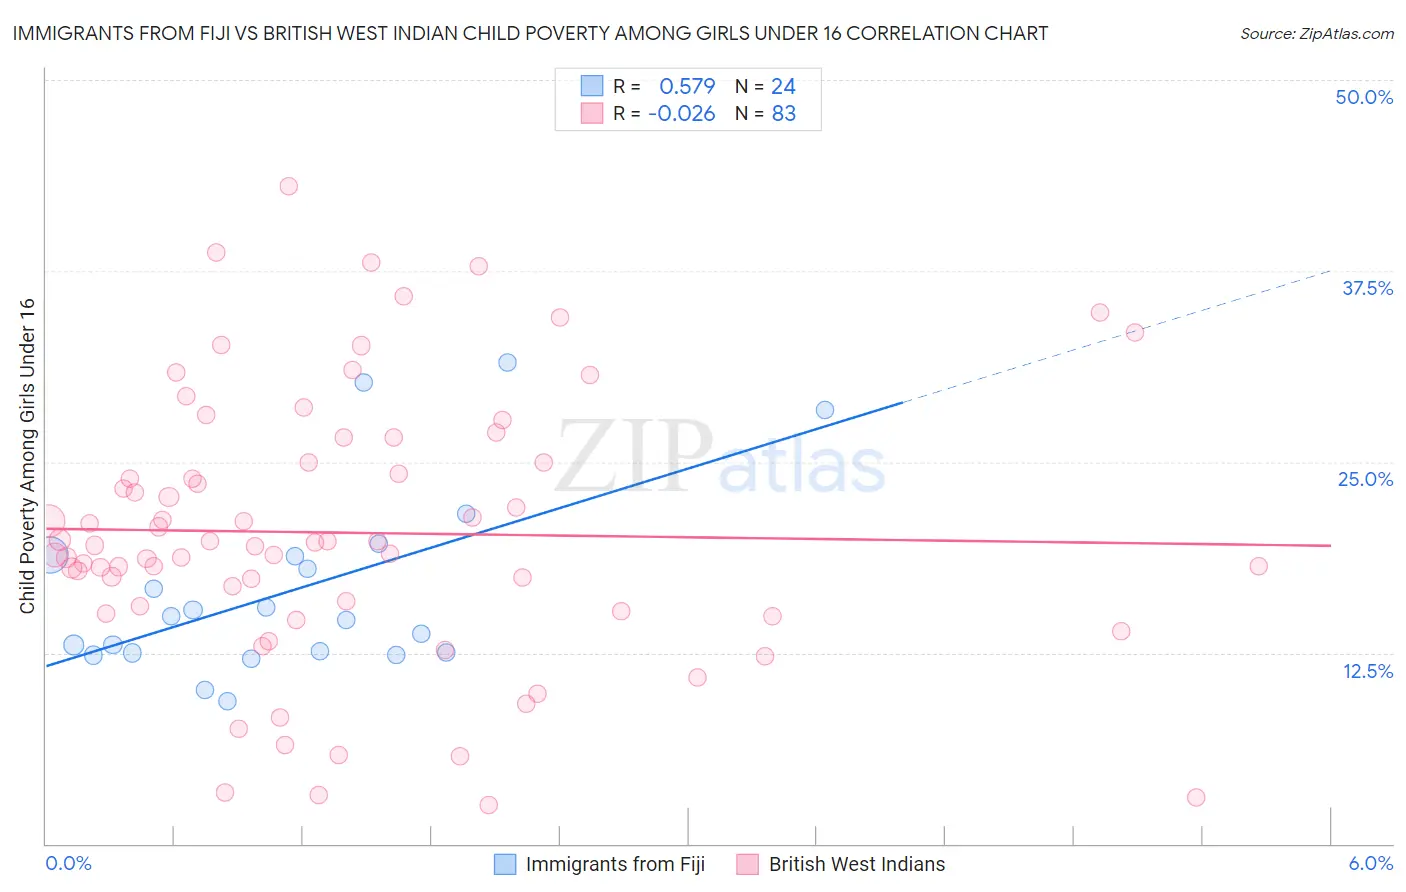
Immigrants from Fiji vs British West Indian Child Poverty Among Girls Under 16 Correlation Chart
The statistical analysis conducted on geographies consisting of 93,514,915 people shows a substantial positive correlation between the proportion of Immigrants from Fiji and poverty level among girls under the age of 16 in the United States with a correlation coefficient (R) of 0.579 and weighted average of 15.9%. Similarly, the statistical analysis conducted on geographies consisting of 151,588,382 people shows no correlation between the proportion of British West Indians and poverty level among girls under the age of 16 in the United States with a correlation coefficient (R) of -0.026 and weighted average of 21.3%, a difference of 33.6%.
Child Poverty Among Girls Under 16 Correlation Summary
| Measurement | Immigrants from Fiji | British West Indian |
| Minimum | 9.3% | 2.5% |
| Maximum | 31.5% | 43.1% |
| Range | 22.2% | 40.6% |
| Mean | 16.6% | 20.4% |
| Median | 14.8% | 19.6% |
| Interquartile 25% (IQ1) | 12.5% | 15.2% |
| Interquartile 75% (IQ3) | 18.9% | 25.0% |
| Interquartile Range (IQR) | 6.4% | 9.8% |
| Standard Deviation (Sample) | 6.0% | 8.8% |
| Standard Deviation (Population) | 5.9% | 8.8% |
Similar Demographics by Child Poverty Among Girls Under 16
Demographics Similar to Immigrants from Fiji by Child Poverty Among Girls Under 16
In terms of child poverty among girls under 16, the demographic groups most similar to Immigrants from Fiji are Colombian (15.9%, a difference of 0.0%), Syrian (15.9%, a difference of 0.10%), Immigrants from Chile (15.9%, a difference of 0.11%), Guamanian/Chamorro (15.9%, a difference of 0.12%), and Slovak (15.9%, a difference of 0.13%).
| Demographics | Rating | Rank | Child Poverty Among Girls Under 16 |
| Immigrants | Hungary | 80.9 /100 | #149 | Excellent 15.8% |
| Immigrants | Albania | 80.7 /100 | #150 | Excellent 15.8% |
| Venezuelans | 80.1 /100 | #151 | Excellent 15.8% |
| Immigrants | Kuwait | 79.4 /100 | #152 | Good 15.8% |
| Immigrants | Nepal | 78.5 /100 | #153 | Good 15.9% |
| Immigrants | Chile | 76.7 /100 | #154 | Good 15.9% |
| Syrians | 76.7 /100 | #155 | Good 15.9% |
| Immigrants | Fiji | 76.1 /100 | #156 | Good 15.9% |
| Colombians | 76.1 /100 | #157 | Good 15.9% |
| Guamanians/Chamorros | 75.3 /100 | #158 | Good 15.9% |
| Slovaks | 75.2 /100 | #159 | Good 15.9% |
| French | 72.8 /100 | #160 | Good 16.0% |
| Immigrants | Northern Africa | 72.0 /100 | #161 | Good 16.0% |
| French Canadians | 68.7 /100 | #162 | Good 16.1% |
| Immigrants | Oceania | 68.4 /100 | #163 | Good 16.1% |
Demographics Similar to British West Indians by Child Poverty Among Girls Under 16
In terms of child poverty among girls under 16, the demographic groups most similar to British West Indians are Indonesian (21.3%, a difference of 0.030%), Seminole (21.2%, a difference of 0.45%), Choctaw (21.1%, a difference of 0.57%), Guatemalan (21.4%, a difference of 0.65%), and Immigrants from Central America (21.4%, a difference of 0.82%).
| Demographics | Rating | Rank | Child Poverty Among Girls Under 16 |
| Immigrants | West Indies | 0.0 /100 | #296 | Tragic 20.7% |
| Inupiat | 0.0 /100 | #297 | Tragic 20.8% |
| Mexicans | 0.0 /100 | #298 | Tragic 20.9% |
| Hispanics or Latinos | 0.0 /100 | #299 | Tragic 21.0% |
| Somalis | 0.0 /100 | #300 | Tragic 21.0% |
| Choctaw | 0.0 /100 | #301 | Tragic 21.1% |
| Seminole | 0.0 /100 | #302 | Tragic 21.2% |
| British West Indians | 0.0 /100 | #303 | Tragic 21.3% |
| Indonesians | 0.0 /100 | #304 | Tragic 21.3% |
| Guatemalans | 0.0 /100 | #305 | Tragic 21.4% |
| Immigrants | Central America | 0.0 /100 | #306 | Tragic 21.4% |
| Immigrants | Bahamas | 0.0 /100 | #307 | Tragic 21.4% |
| Houma | 0.0 /100 | #308 | Tragic 21.5% |
| Bahamians | 0.0 /100 | #309 | Tragic 21.5% |
| Immigrants | Somalia | 0.0 /100 | #310 | Tragic 21.6% |