Immigrants from Bosnia and Herzegovina vs South African Female Poverty Among 25-34 Year Olds

COMPARE

Immigrants from Bosnia and Herzegovina
Race
Ancestry
AfghanAfricanAlaska NativeAlaskan AthabascanAlbanianAleutAlsatianAmericanApacheArabArapahoArgentineanArmenianAssyrian/Chaldean/SyriacAustralianAustrianBahamianBangladeshiBarbadianBasqueBelgianBelizeanBermudanBhutaneseBlackfeetBolivianBrazilianBritishBritish West IndianBulgarianBurmeseCajunCambodianCanadianCape VerdeanCarpatho RusynCelticCentral AmericanCentral American IndianCherokeeCheyenneChickasawChileanChineseChippewaChoctawColombianColvilleComancheCosta RicanCreeCreekCroatianCrowCubanCypriotCzechCzechoslovakianDanishDelawareDominicanDutchDutch West IndianEastern EuropeanEcuadorianEgyptianEnglishEstonianEthiopianEuropeanFijianFilipinoFinnishFrenchFrench American IndianFrench CanadianGermanGerman RussianGhanaianGreekGuamanian/ChamorroGuatemalanGuyaneseHaitianHmongHonduranHopiHoumaHungarianIcelanderIndian (Asian)IndonesianInupiatIranianIraqiIrishIroquoisIsraeliItalianJamaicanJapaneseJordanianKenyanKiowaKoreanLaotianLatvianLebaneseLiberianLithuanianLumbeeLuxembourgerMacedonianMalaysianMalteseMarshalleseMenomineeMexicanMexican American IndianMongolianMoroccanNative HawaiianNavajoNepaleseNew ZealanderNicaraguanNigerianNorthern EuropeanNorwegianOkinawanOsageOttawaPaiutePakistaniPalestinianPanamanianParaguayanPennsylvania GermanPeruvianPimaPolishPortuguesePotawatomiPuebloPuerto RicanPuget Sound SalishRomanianRussianSalvadoranSamoanScandinavianScotch-IrishScottishSeminoleSenegaleseSerbianShoshoneSierra LeoneanSiouxSlavicSlovakSloveneSomaliSouth AmericanSouth American IndianSoviet UnionSpaniardSpanishSpanish AmericanSpanish American IndianSri LankanSubsaharan AfricanSudaneseSwedishSwissSyrianTaiwaneseThaiTlingit-HaidaTohono O'OdhamTonganTrinidadian and TobagonianTsimshianTurkishU.S. Virgin IslanderUgandanUkrainianUruguayanUteVenezuelanVietnameseWelshWest IndianYakamaYaquiYugoslavianYumanYup'ikZimbabwean
Immigration
NonimmigrantsImmigrantsAfghanistanAfricaAlbaniaArgentinaArmeniaAsiaAustraliaAustriaBahamasBangladeshBarbadosBelarusBelgiumBelizeBoliviaBosnia and HerzegovinaBrazilBulgariaBurma/MyanmarCabo VerdeCambodiaCameroonCanadaCaribbeanCentral AmericaChileChinaColombiaCongoCosta RicaCroatiaCubaCzechoslovakiaDenmarkDominicaDominican RepublicEastern AfricaEastern AsiaEastern EuropeEcuadorEgyptEl SalvadorEnglandEritreaEthiopiaEuropeFijiFranceGermanyGhanaGreeceGrenadaGuatemalaGuyanaHaitiHondurasHong KongHungaryIndiaIndonesiaIranIraqIrelandIsraelItalyJamaicaJapanJordanKazakhstanKenyaKoreaKuwaitLaosLatin AmericaLatviaLebanonLiberiaLithuaniaMalaysiaMexicoMicronesiaMiddle AfricaMoldovaMoroccoNepalNetherlandsNicaraguaNigeriaNorth AmericaNorth MacedoniaNorthern AfricaNorthern EuropeNorwayOceaniaPakistanPanamaPeruPhilippinesPolandPortugalRomaniaRussiaSaudi ArabiaScotlandSenegalSerbiaSierra LeoneSingaporeSomaliaSouth AfricaSouth AmericaSouth Central AsiaSouth Eastern AsiaSouthern EuropeSpainSri LankaSt. Vincent and the GrenadinesSudanSwedenSwitzerlandSyriaTaiwanThailandTrinidad and TobagoTurkeyUgandaUkraineUruguayUzbekistanVenezuelaVietnamWest IndiesWestern AfricaWestern AsiaWestern EuropeYemenZaireZimbabweAzores
South African
Race
Ancestry
AfghanAfricanAlaska NativeAlaskan AthabascanAlbanianAleutAlsatianAmericanApacheArabArapahoArgentineanArmenianAssyrian/Chaldean/SyriacAustralianAustrianBahamianBangladeshiBarbadianBasqueBelgianBelizeanBermudanBhutaneseBlackfeetBolivianBrazilianBritishBritish West IndianBulgarianBurmeseCajunCambodianCanadianCape VerdeanCarpatho RusynCelticCentral AmericanCentral American IndianCherokeeCheyenneChickasawChileanChineseChippewaChoctawColombianColvilleComancheCosta RicanCreeCreekCroatianCrowCubanCypriotCzechCzechoslovakianDanishDelawareDominicanDutchDutch West IndianEastern EuropeanEcuadorianEgyptianEnglishEstonianEthiopianEuropeanFijianFilipinoFinnishFrenchFrench American IndianFrench CanadianGermanGerman RussianGhanaianGreekGuamanian/ChamorroGuatemalanGuyaneseHaitianHmongHonduranHopiHoumaHungarianIcelanderIndian (Asian)IndonesianInupiatIranianIraqiIrishIroquoisIsraeliItalianJamaicanJapaneseJordanianKenyanKiowaKoreanLaotianLatvianLebaneseLiberianLithuanianLumbeeLuxembourgerMacedonianMalaysianMalteseMarshalleseMenomineeMexicanMexican American IndianMongolianMoroccanNative HawaiianNavajoNepaleseNew ZealanderNicaraguanNigerianNorthern EuropeanNorwegianOkinawanOsageOttawaPaiutePakistaniPalestinianPanamanianParaguayanPennsylvania GermanPeruvianPimaPolishPortuguesePotawatomiPuebloPuerto RicanPuget Sound SalishRomanianRussianSalvadoranSamoanScandinavianScotch-IrishScottishSeminoleSenegaleseSerbianShoshoneSierra LeoneanSiouxSlavicSlovakSloveneSomaliSouth AfricanSouth AmericanSouth American IndianSoviet UnionSpaniardSpanishSpanish AmericanSpanish American IndianSri LankanSubsaharan AfricanSudaneseSwedishSwissSyrianTaiwaneseThaiTlingit-HaidaTohono O'OdhamTonganTrinidadian and TobagonianTsimshianTurkishU.S. Virgin IslanderUgandanUkrainianUruguayanUteVenezuelanVietnameseWelshWest IndianYakamaYaquiYugoslavianYumanYup'ikZimbabwean
Immigration
NonimmigrantsImmigrantsAfghanistanAfricaAlbaniaArgentinaArmeniaAsiaAustraliaAustriaBahamasBangladeshBarbadosBelarusBelgiumBelizeBoliviaBrazilBulgariaBurma/MyanmarCabo VerdeCambodiaCameroonCanadaCaribbeanCentral AmericaChileChinaColombiaCongoCosta RicaCroatiaCubaCzechoslovakiaDenmarkDominicaDominican RepublicEastern AfricaEastern AsiaEastern EuropeEcuadorEgyptEl SalvadorEnglandEritreaEthiopiaEuropeFijiFranceGermanyGhanaGreeceGrenadaGuatemalaGuyanaHaitiHondurasHong KongHungaryIndiaIndonesiaIranIraqIrelandIsraelItalyJamaicaJapanJordanKazakhstanKenyaKoreaKuwaitLaosLatin AmericaLatviaLebanonLiberiaLithuaniaMalaysiaMexicoMicronesiaMiddle AfricaMoldovaMoroccoNepalNetherlandsNicaraguaNigeriaNorth AmericaNorth MacedoniaNorthern AfricaNorthern EuropeNorwayOceaniaPakistanPanamaPeruPhilippinesPolandPortugalRomaniaRussiaSaudi ArabiaScotlandSenegalSerbiaSierra LeoneSingaporeSomaliaSouth AfricaSouth AmericaSouth Central AsiaSouth Eastern AsiaSouthern EuropeSpainSri LankaSt. Vincent and the GrenadinesSudanSwedenSwitzerlandSyriaTaiwanThailandTrinidad and TobagoTurkeyUgandaUkraineUruguayUzbekistanVenezuelaVietnamWest IndiesWestern AfricaWestern AsiaWestern EuropeYemenZaireZimbabweAzores
Female Poverty Among 25-34 Year Olds
Income
Poverty
Unemployment
Labor Participation
Family Structure
Vehicle Availability
Education Level
Disability

Female Poverty Among 25-34 Year Olds Comparison

Immigrants from Bosnia and Herzegovina

South Africans

Average
Excellent
13.4%
FEMALE POVERTY AMONG 25-34 YEAR OLDS
58.6/ 100
METRIC RATING
167th/ 347
METRIC RANK
13.0%
FEMALE POVERTY AMONG 25-34 YEAR OLDS
85.7/ 100
METRIC RATING
135th/ 347
METRIC RANK

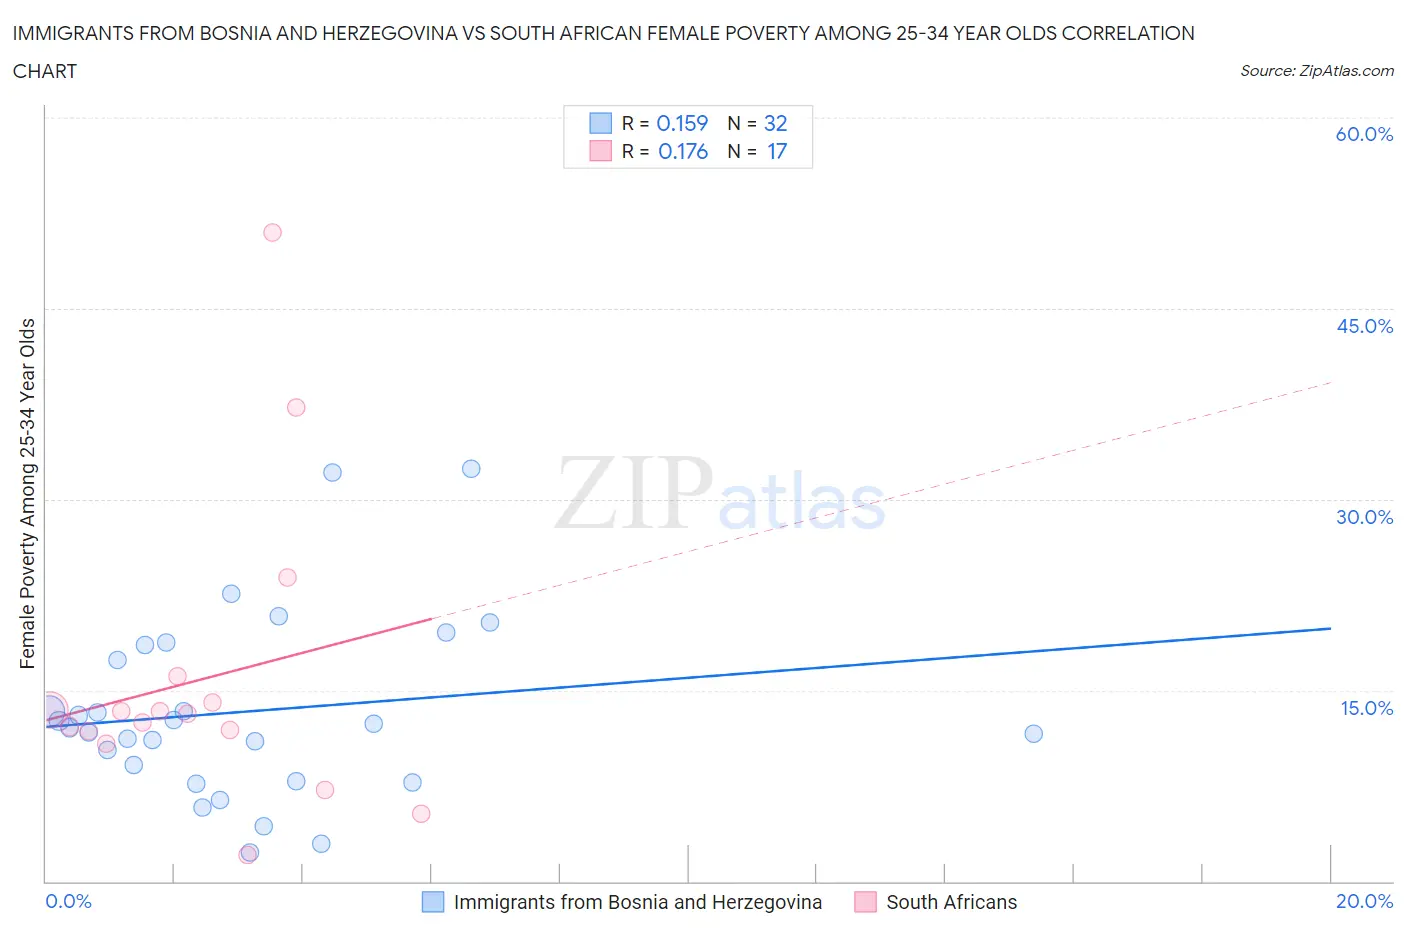
Immigrants from Bosnia and Herzegovina vs South African Female Poverty Among 25-34 Year Olds Correlation Chart

The statistical analysis conducted on geographies consisting of 155,781,915 people shows a poor positive correlation between the proportion of Immigrants from Bosnia and Herzegovina and poverty level among females between the ages 25 and 34 in the United States with a correlation coefficient (R) of 0.159 and weighted average of 13.4%. Similarly, the statistical analysis conducted on geographies consisting of 180,794,089 people shows a poor positive correlation between the proportion of South Africans and poverty level among females between the ages 25 and 34 in the United States with a correlation coefficient (R) of 0.176 and weighted average of 13.0%, a difference of 3.1%.
Immigrants from Bosnia and Herzegovina vs South African Female Poverty Among 25-34 Year Olds

Female Poverty Among 25-34 Year Olds Correlation Summary

MeasurementImmigrants from Bosnia and HerzegovinaSouth African
Minimum2.2%2.0%
Maximum32.4%51.0%
Range30.2%49.0%
Mean13.3%15.8%
Median12.2%13.2%
Interquartile 25% (IQ1)8.5%11.3%
Interquartile 75% (IQ3)18.0%15.1%
Interquartile Range (IQR)9.5%3.8%
Standard Deviation (Sample)7.1%11.8%
Standard Deviation (Population)7.0%11.5%

Similar Demographics by Female Poverty Among 25-34 Year Olds

Demographics Similar to Immigrants from Bosnia and Herzegovina by Female Poverty Among 25-34 Year Olds

In terms of female poverty among 25-34 year olds, the demographic groups most similar to Immigrants from Bosnia and Herzegovina are Belgian (13.4%, a difference of 0.020%), Basque (13.4%, a difference of 0.060%), Immigrants from Afghanistan (13.4%, a difference of 0.080%), Samoan (13.5%, a difference of 0.16%), and Swiss (13.4%, a difference of 0.27%).
DemographicsRating | RankFemale Poverty Among 25-34 Year Olds
Immigrants | South America
66.3
/100
|
#160
Good
13.3%
Icelanders
65.7
/100
|
#161
Good
13.3%
Ugandans
64.1
/100
|
#162
Good
13.4%
British
63.5
/100
|
#163
Good
13.4%
Swiss
61.7
/100
|
#164
Good
13.4%
Basques
59.3
/100
|
#165
Average
13.4%
Belgians
58.9
/100
|
#166
Average
13.4%
Immigrants | Bosnia and Herzegovina
58.6
/100
|
#167
Average
13.4%
Immigrants | Afghanistan
57.7
/100
|
#168
Average
13.4%
Samoans
56.8
/100
|
#169
Average
13.5%
Immigrants | Uganda
53.0
/100
|
#170
Average
13.5%
South American Indians
51.9
/100
|
#171
Average
13.5%
Immigrants | Costa Rica
51.9
/100
|
#172
Average
13.5%
Kenyans
51.8
/100
|
#173
Average
13.5%
Immigrants | Oceania
50.0
/100
|
#174
Average
13.5%

Demographics Similar to South Africans by Female Poverty Among 25-34 Year Olds

In terms of female poverty among 25-34 year olds, the demographic groups most similar to South Africans are Afghan (13.0%, a difference of 0.020%), Immigrants from England (13.0%, a difference of 0.020%), Immigrants from Chile (13.1%, a difference of 0.18%), Brazilian (13.1%, a difference of 0.20%), and Austrian (13.1%, a difference of 0.32%).
DemographicsRating | RankFemale Poverty Among 25-34 Year Olds
Syrians
90.2
/100
|
#128
Exceptional
12.9%
Immigrants | North America
89.7
/100
|
#129
Excellent
12.9%
Immigrants | Uzbekistan
89.6
/100
|
#130
Excellent
12.9%
Pakistanis
88.4
/100
|
#131
Excellent
13.0%
Immigrants | Hungary
88.3
/100
|
#132
Excellent
13.0%
Serbians
87.6
/100
|
#133
Excellent
13.0%
Afghans
85.8
/100
|
#134
Excellent
13.0%
South Africans
85.7
/100
|
#135
Excellent
13.0%
Immigrants | England
85.5
/100
|
#136
Excellent
13.0%
Immigrants | Chile
84.6
/100
|
#137
Excellent
13.1%
Brazilians
84.5
/100
|
#138
Excellent
13.1%
Austrians
83.7
/100
|
#139
Excellent
13.1%
Immigrants | Iraq
83.6
/100
|
#140
Excellent
13.1%
New Zealanders
83.4
/100
|
#141
Excellent
13.1%
Scandinavians
82.3
/100
|
#142
Excellent
13.1%