Immigrants from Bosnia and Herzegovina vs Lumbee Female Poverty Among 25-34 Year Olds
COMPARE
Immigrants from Bosnia and Herzegovina
Lumbee
Female Poverty Among 25-34 Year Olds
Female Poverty Among 25-34 Year Olds Comparison
Immigrants from Bosnia and Herzegovina
Lumbee
13.4%
FEMALE POVERTY AMONG 25-34 YEAR OLDS
58.6/ 100
METRIC RATING
167th/ 347
METRIC RANK
26.3%
FEMALE POVERTY AMONG 25-34 YEAR OLDS
0.0/ 100
METRIC RATING
346th/ 347
METRIC RANK
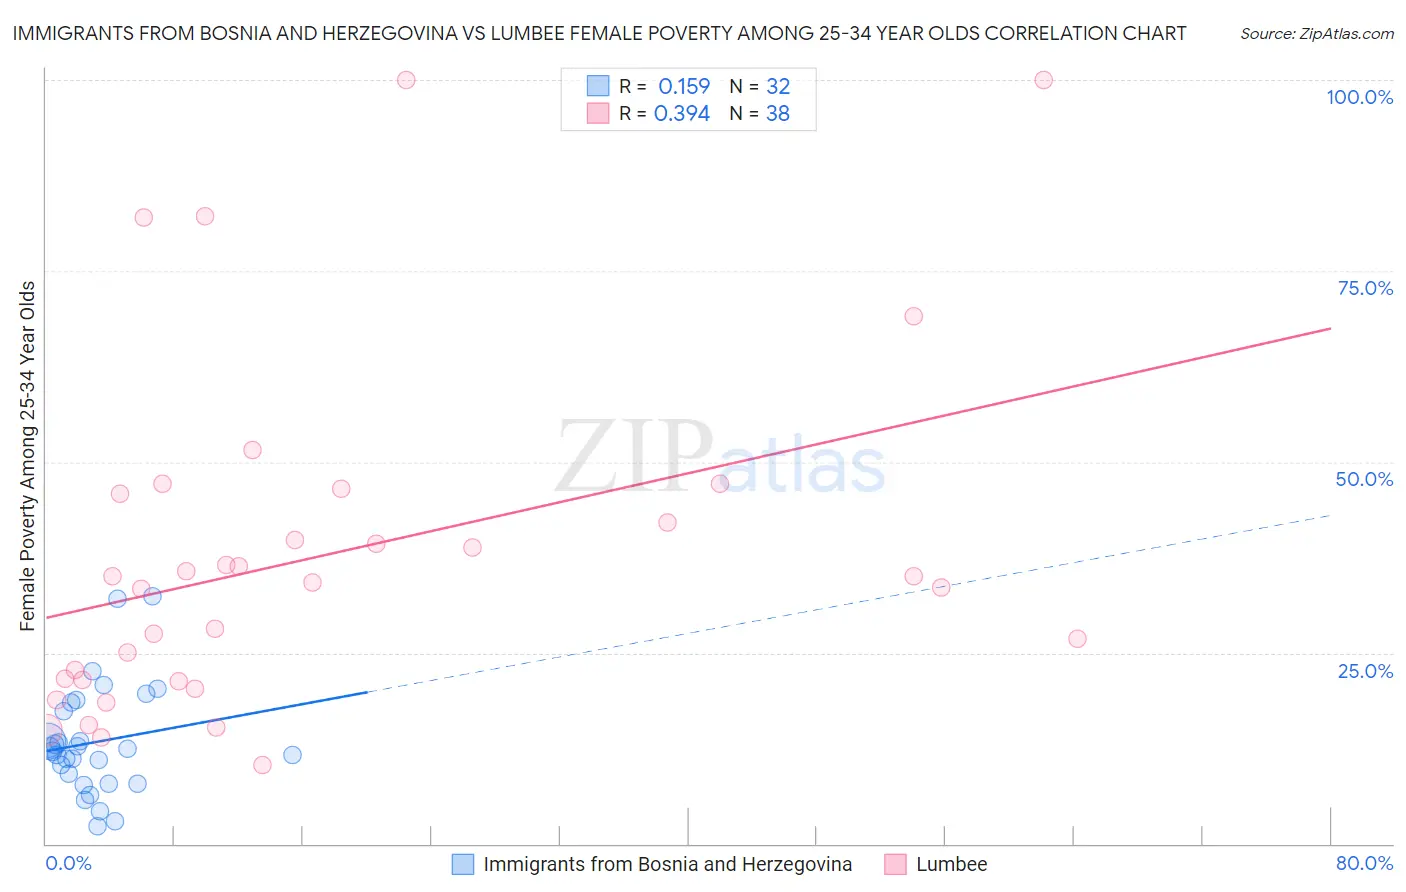
Immigrants from Bosnia and Herzegovina vs Lumbee Female Poverty Among 25-34 Year Olds Correlation Chart
The statistical analysis conducted on geographies consisting of 155,781,915 people shows a poor positive correlation between the proportion of Immigrants from Bosnia and Herzegovina and poverty level among females between the ages 25 and 34 in the United States with a correlation coefficient (R) of 0.159 and weighted average of 13.4%. Similarly, the statistical analysis conducted on geographies consisting of 91,764,712 people shows a mild positive correlation between the proportion of Lumbee and poverty level among females between the ages 25 and 34 in the United States with a correlation coefficient (R) of 0.394 and weighted average of 26.3%, a difference of 95.6%.
Female Poverty Among 25-34 Year Olds Correlation Summary
| Measurement | Immigrants from Bosnia and Herzegovina | Lumbee |
| Minimum | 2.2% | 10.3% |
| Maximum | 32.4% | 100.0% |
| Range | 30.2% | 89.7% |
| Mean | 13.3% | 37.7% |
| Median | 12.2% | 34.5% |
| Interquartile 25% (IQ1) | 8.5% | 21.5% |
| Interquartile 75% (IQ3) | 18.0% | 45.8% |
| Interquartile Range (IQR) | 9.5% | 24.3% |
| Standard Deviation (Sample) | 7.1% | 22.5% |
| Standard Deviation (Population) | 7.0% | 22.2% |
Similar Demographics by Female Poverty Among 25-34 Year Olds
Demographics Similar to Immigrants from Bosnia and Herzegovina by Female Poverty Among 25-34 Year Olds
In terms of female poverty among 25-34 year olds, the demographic groups most similar to Immigrants from Bosnia and Herzegovina are Belgian (13.4%, a difference of 0.020%), Basque (13.4%, a difference of 0.060%), Immigrants from Afghanistan (13.4%, a difference of 0.080%), Samoan (13.5%, a difference of 0.16%), and Swiss (13.4%, a difference of 0.27%).
| Demographics | Rating | Rank | Female Poverty Among 25-34 Year Olds |
| Immigrants | South America | 66.3 /100 | #160 | Good 13.3% |
| Icelanders | 65.7 /100 | #161 | Good 13.3% |
| Ugandans | 64.1 /100 | #162 | Good 13.4% |
| British | 63.5 /100 | #163 | Good 13.4% |
| Swiss | 61.7 /100 | #164 | Good 13.4% |
| Basques | 59.3 /100 | #165 | Average 13.4% |
| Belgians | 58.9 /100 | #166 | Average 13.4% |
| Immigrants | Bosnia and Herzegovina | 58.6 /100 | #167 | Average 13.4% |
| Immigrants | Afghanistan | 57.7 /100 | #168 | Average 13.4% |
| Samoans | 56.8 /100 | #169 | Average 13.5% |
| Immigrants | Uganda | 53.0 /100 | #170 | Average 13.5% |
| South American Indians | 51.9 /100 | #171 | Average 13.5% |
| Immigrants | Costa Rica | 51.9 /100 | #172 | Average 13.5% |
| Kenyans | 51.8 /100 | #173 | Average 13.5% |
| Immigrants | Oceania | 50.0 /100 | #174 | Average 13.5% |
Demographics Similar to Lumbee by Female Poverty Among 25-34 Year Olds
In terms of female poverty among 25-34 year olds, the demographic groups most similar to Lumbee are Puerto Rican (26.3%, a difference of 0.030%), Pima (25.3%, a difference of 3.9%), Tohono O'odham (24.7%, a difference of 6.2%), Yup'ik (24.3%, a difference of 8.1%), and Hopi (23.7%, a difference of 11.0%).
| Demographics | Rating | Rank | Female Poverty Among 25-34 Year Olds |
| Cajuns | 0.0 /100 | #333 | Tragic 19.9% |
| Apache | 0.0 /100 | #334 | Tragic 20.1% |
| Natives/Alaskans | 0.0 /100 | #335 | Tragic 20.3% |
| Pueblo | 0.0 /100 | #336 | Tragic 22.2% |
| Crow | 0.0 /100 | #337 | Tragic 22.7% |
| Houma | 0.0 /100 | #338 | Tragic 22.7% |
| Yuman | 0.0 /100 | #339 | Tragic 22.9% |
| Sioux | 0.0 /100 | #340 | Tragic 23.0% |
| Navajo | 0.0 /100 | #341 | Tragic 23.3% |
| Hopi | 0.0 /100 | #342 | Tragic 23.7% |
| Yup'ik | 0.0 /100 | #343 | Tragic 24.3% |
| Tohono O'odham | 0.0 /100 | #344 | Tragic 24.7% |
| Pima | 0.0 /100 | #345 | Tragic 25.3% |
| Lumbee | 0.0 /100 | #346 | Tragic 26.3% |
| Puerto Ricans | 0.0 /100 | #347 | Tragic 26.3% |