Immigrants from Bosnia and Herzegovina vs Immigrants from North Macedonia Female Poverty Among 25-34 Year Olds
COMPARE
Immigrants from Bosnia and Herzegovina
Immigrants from North Macedonia
Female Poverty Among 25-34 Year Olds
Female Poverty Among 25-34 Year Olds Comparison
Immigrants from Bosnia and Herzegovina
Immigrants from North Macedonia
13.4%
FEMALE POVERTY AMONG 25-34 YEAR OLDS
58.6/ 100
METRIC RATING
167th/ 347
METRIC RANK
11.8%
FEMALE POVERTY AMONG 25-34 YEAR OLDS
99.8/ 100
METRIC RATING
38th/ 347
METRIC RANK
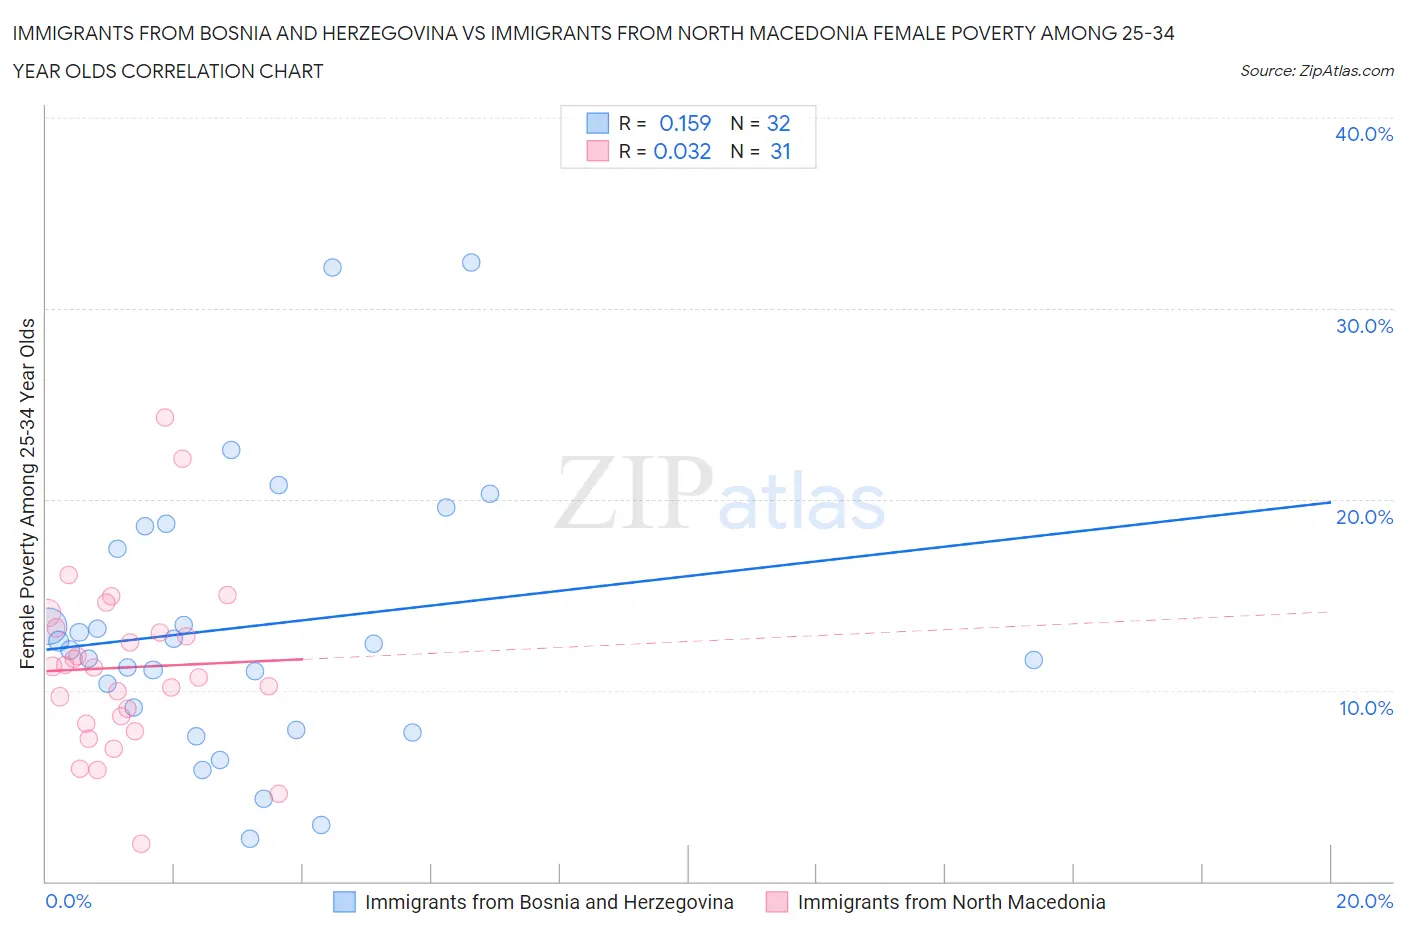
Immigrants from Bosnia and Herzegovina vs Immigrants from North Macedonia Female Poverty Among 25-34 Year Olds Correlation Chart
The statistical analysis conducted on geographies consisting of 155,781,915 people shows a poor positive correlation between the proportion of Immigrants from Bosnia and Herzegovina and poverty level among females between the ages 25 and 34 in the United States with a correlation coefficient (R) of 0.159 and weighted average of 13.4%. Similarly, the statistical analysis conducted on geographies consisting of 73,602,403 people shows no correlation between the proportion of Immigrants from North Macedonia and poverty level among females between the ages 25 and 34 in the United States with a correlation coefficient (R) of 0.032 and weighted average of 11.8%, a difference of 14.1%.
Female Poverty Among 25-34 Year Olds Correlation Summary
| Measurement | Immigrants from Bosnia and Herzegovina | Immigrants from North Macedonia |
| Minimum | 2.2% | 2.0% |
| Maximum | 32.4% | 24.3% |
| Range | 30.2% | 22.3% |
| Mean | 13.3% | 11.2% |
| Median | 12.2% | 11.2% |
| Interquartile 25% (IQ1) | 8.5% | 8.2% |
| Interquartile 75% (IQ3) | 18.0% | 13.3% |
| Interquartile Range (IQR) | 9.5% | 5.0% |
| Standard Deviation (Sample) | 7.1% | 4.6% |
| Standard Deviation (Population) | 7.0% | 4.5% |
Similar Demographics by Female Poverty Among 25-34 Year Olds
Demographics Similar to Immigrants from Bosnia and Herzegovina by Female Poverty Among 25-34 Year Olds
In terms of female poverty among 25-34 year olds, the demographic groups most similar to Immigrants from Bosnia and Herzegovina are Belgian (13.4%, a difference of 0.020%), Basque (13.4%, a difference of 0.060%), Immigrants from Afghanistan (13.4%, a difference of 0.080%), Samoan (13.5%, a difference of 0.16%), and Swiss (13.4%, a difference of 0.27%).
| Demographics | Rating | Rank | Female Poverty Among 25-34 Year Olds |
| Immigrants | South America | 66.3 /100 | #160 | Good 13.3% |
| Icelanders | 65.7 /100 | #161 | Good 13.3% |
| Ugandans | 64.1 /100 | #162 | Good 13.4% |
| British | 63.5 /100 | #163 | Good 13.4% |
| Swiss | 61.7 /100 | #164 | Good 13.4% |
| Basques | 59.3 /100 | #165 | Average 13.4% |
| Belgians | 58.9 /100 | #166 | Average 13.4% |
| Immigrants | Bosnia and Herzegovina | 58.6 /100 | #167 | Average 13.4% |
| Immigrants | Afghanistan | 57.7 /100 | #168 | Average 13.4% |
| Samoans | 56.8 /100 | #169 | Average 13.5% |
| Immigrants | Uganda | 53.0 /100 | #170 | Average 13.5% |
| South American Indians | 51.9 /100 | #171 | Average 13.5% |
| Immigrants | Costa Rica | 51.9 /100 | #172 | Average 13.5% |
| Kenyans | 51.8 /100 | #173 | Average 13.5% |
| Immigrants | Oceania | 50.0 /100 | #174 | Average 13.5% |
Demographics Similar to Immigrants from North Macedonia by Female Poverty Among 25-34 Year Olds
In terms of female poverty among 25-34 year olds, the demographic groups most similar to Immigrants from North Macedonia are Taiwanese (11.8%, a difference of 0.070%), Immigrants from Sri Lanka (11.8%, a difference of 0.23%), Latvian (11.8%, a difference of 0.25%), Immigrants from Bulgaria (11.8%, a difference of 0.41%), and Immigrants from Indonesia (11.8%, a difference of 0.54%).
| Demographics | Rating | Rank | Female Poverty Among 25-34 Year Olds |
| Immigrants | Japan | 99.9 /100 | #31 | Exceptional 11.6% |
| Immigrants | Asia | 99.9 /100 | #32 | Exceptional 11.6% |
| Immigrants | Poland | 99.9 /100 | #33 | Exceptional 11.6% |
| Zimbabweans | 99.9 /100 | #34 | Exceptional 11.7% |
| Cambodians | 99.9 /100 | #35 | Exceptional 11.7% |
| Immigrants | Sri Lanka | 99.8 /100 | #36 | Exceptional 11.8% |
| Taiwanese | 99.8 /100 | #37 | Exceptional 11.8% |
| Immigrants | North Macedonia | 99.8 /100 | #38 | Exceptional 11.8% |
| Latvians | 99.8 /100 | #39 | Exceptional 11.8% |
| Immigrants | Bulgaria | 99.8 /100 | #40 | Exceptional 11.8% |
| Immigrants | Indonesia | 99.8 /100 | #41 | Exceptional 11.8% |
| Immigrants | Turkey | 99.7 /100 | #42 | Exceptional 11.9% |
| Egyptians | 99.7 /100 | #43 | Exceptional 11.9% |
| Immigrants | Australia | 99.7 /100 | #44 | Exceptional 11.9% |
| Macedonians | 99.7 /100 | #45 | Exceptional 11.9% |