Immigrants from Bosnia and Herzegovina vs South African 5th Grade
COMPARE
Immigrants from Bosnia and Herzegovina
South African
5th Grade
5th Grade Comparison
Immigrants from Bosnia and Herzegovina
South Africans
97.4%
5TH GRADE
71.0/ 100
METRIC RATING
155th/ 347
METRIC RANK
97.7%
5TH GRADE
98.3/ 100
METRIC RATING
101st/ 347
METRIC RANK
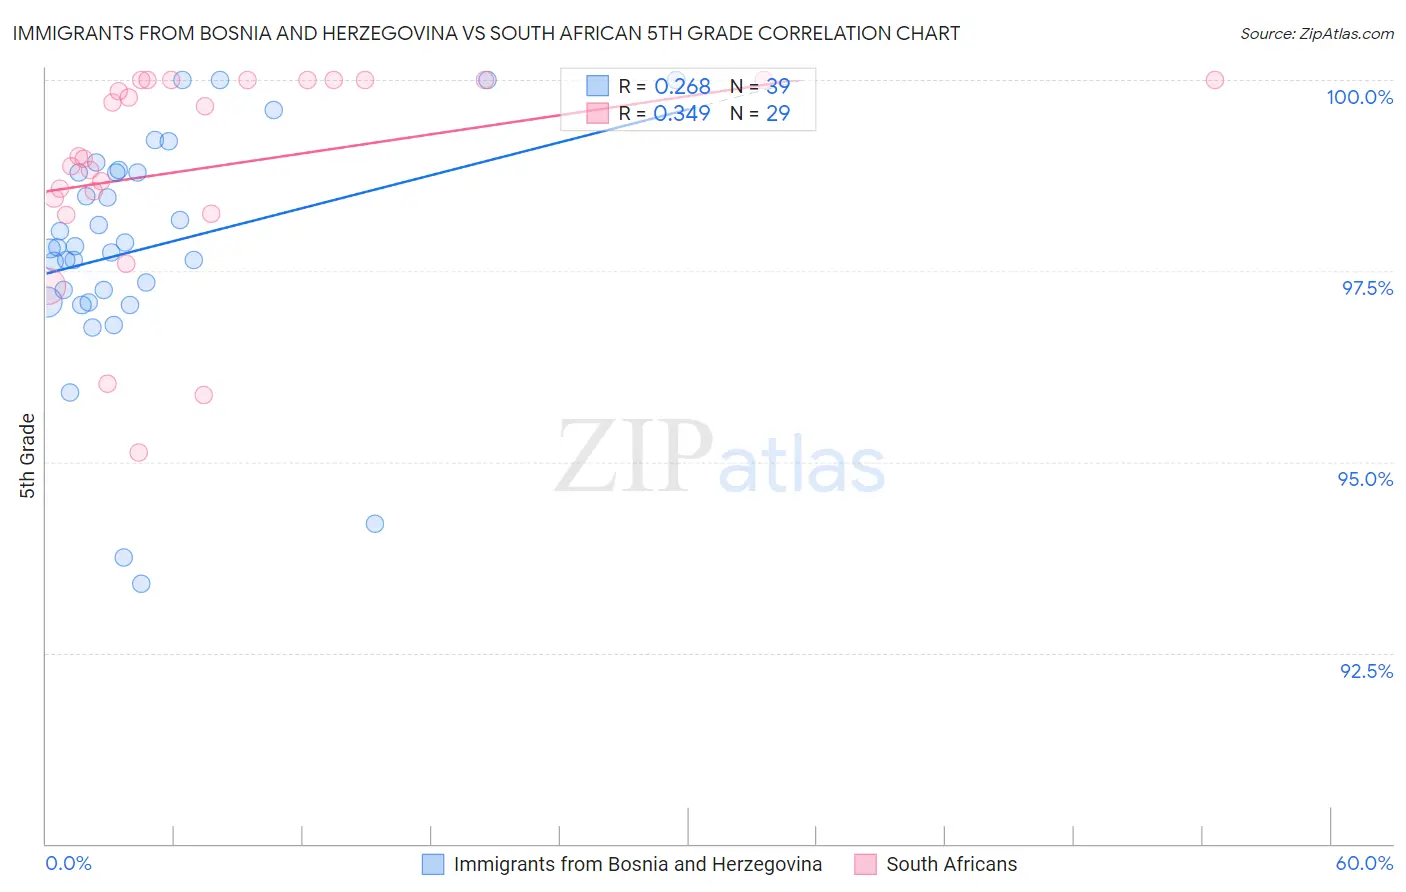
Immigrants from Bosnia and Herzegovina vs South African 5th Grade Correlation Chart
The statistical analysis conducted on geographies consisting of 156,779,463 people shows a weak positive correlation between the proportion of Immigrants from Bosnia and Herzegovina and percentage of population with at least 5th grade education in the United States with a correlation coefficient (R) of 0.268 and weighted average of 97.4%. Similarly, the statistical analysis conducted on geographies consisting of 182,604,532 people shows a mild positive correlation between the proportion of South Africans and percentage of population with at least 5th grade education in the United States with a correlation coefficient (R) of 0.349 and weighted average of 97.7%, a difference of 0.33%.
5th Grade Correlation Summary
| Measurement | Immigrants from Bosnia and Herzegovina | South African |
| Minimum | 93.4% | 95.1% |
| Maximum | 100.0% | 100.0% |
| Range | 6.6% | 4.9% |
| Mean | 97.8% | 98.9% |
| Median | 97.8% | 99.0% |
| Interquartile 25% (IQ1) | 97.1% | 98.3% |
| Interquartile 75% (IQ3) | 98.8% | 100.0% |
| Interquartile Range (IQR) | 1.7% | 1.7% |
| Standard Deviation (Sample) | 1.5% | 1.4% |
| Standard Deviation (Population) | 1.5% | 1.3% |
Similar Demographics by 5th Grade
Demographics Similar to Immigrants from Bosnia and Herzegovina by 5th Grade
In terms of 5th grade, the demographic groups most similar to Immigrants from Bosnia and Herzegovina are Immigrants from Russia (97.4%, a difference of 0.0%), French American Indian (97.4%, a difference of 0.0%), Immigrants from Jordan (97.4%, a difference of 0.0%), Albanian (97.4%, a difference of 0.010%), and Immigrants from Eastern Europe (97.4%, a difference of 0.020%).
| Demographics | Rating | Rank | 5th Grade |
| Immigrants | Israel | 79.1 /100 | #148 | Good 97.5% |
| Hopi | 78.6 /100 | #149 | Good 97.5% |
| Immigrants | South Central Asia | 78.6 /100 | #150 | Good 97.5% |
| Immigrants | Eastern Europe | 75.0 /100 | #151 | Good 97.4% |
| Ute | 74.9 /100 | #152 | Good 97.4% |
| Alsatians | 74.3 /100 | #153 | Good 97.4% |
| Immigrants | Russia | 71.2 /100 | #154 | Good 97.4% |
| Immigrants | Bosnia and Herzegovina | 71.0 /100 | #155 | Good 97.4% |
| French American Indians | 70.5 /100 | #156 | Good 97.4% |
| Immigrants | Jordan | 70.4 /100 | #157 | Good 97.4% |
| Albanians | 68.3 /100 | #158 | Good 97.4% |
| Immigrants | Italy | 65.2 /100 | #159 | Good 97.4% |
| Marshallese | 61.2 /100 | #160 | Good 97.4% |
| Kenyans | 59.7 /100 | #161 | Average 97.4% |
| Immigrants | Iran | 59.5 /100 | #162 | Average 97.4% |
Demographics Similar to South Africans by 5th Grade
In terms of 5th grade, the demographic groups most similar to South Africans are Yugoslavian (97.7%, a difference of 0.0%), Turkish (97.7%, a difference of 0.0%), Puget Sound Salish (97.7%, a difference of 0.0%), Cree (97.7%, a difference of 0.010%), and Immigrants from Denmark (97.8%, a difference of 0.020%).
| Demographics | Rating | Rank | 5th Grade |
| Immigrants | Denmark | 98.6 /100 | #94 | Exceptional 97.8% |
| Romanians | 98.6 /100 | #95 | Exceptional 97.8% |
| Immigrants | Germany | 98.5 /100 | #96 | Exceptional 97.8% |
| Cree | 98.4 /100 | #97 | Exceptional 97.7% |
| Yugoslavians | 98.3 /100 | #98 | Exceptional 97.7% |
| Turks | 98.3 /100 | #99 | Exceptional 97.7% |
| Puget Sound Salish | 98.3 /100 | #100 | Exceptional 97.7% |
| South Africans | 98.3 /100 | #101 | Exceptional 97.7% |
| Choctaw | 98.0 /100 | #102 | Exceptional 97.7% |
| Cheyenne | 97.9 /100 | #103 | Exceptional 97.7% |
| German Russians | 97.8 /100 | #104 | Exceptional 97.7% |
| Bhutanese | 97.6 /100 | #105 | Exceptional 97.7% |
| Immigrants | Czechoslovakia | 97.5 /100 | #106 | Exceptional 97.7% |
| Immigrants | Singapore | 97.5 /100 | #107 | Exceptional 97.7% |
| Immigrants | Nonimmigrants | 97.3 /100 | #108 | Exceptional 97.7% |