Immigrants from Bosnia and Herzegovina vs Hmong Receiving Food Stamps
COMPARE
Immigrants from Bosnia and Herzegovina
Hmong
Receiving Food Stamps
Receiving Food Stamps Comparison
Immigrants from Bosnia and Herzegovina
Hmong
11.3%
RECEIVING FOOD STAMPS
72.6/ 100
METRIC RATING
158th/ 347
METRIC RANK
10.9%
RECEIVING FOOD STAMPS
88.4/ 100
METRIC RATING
139th/ 347
METRIC RANK
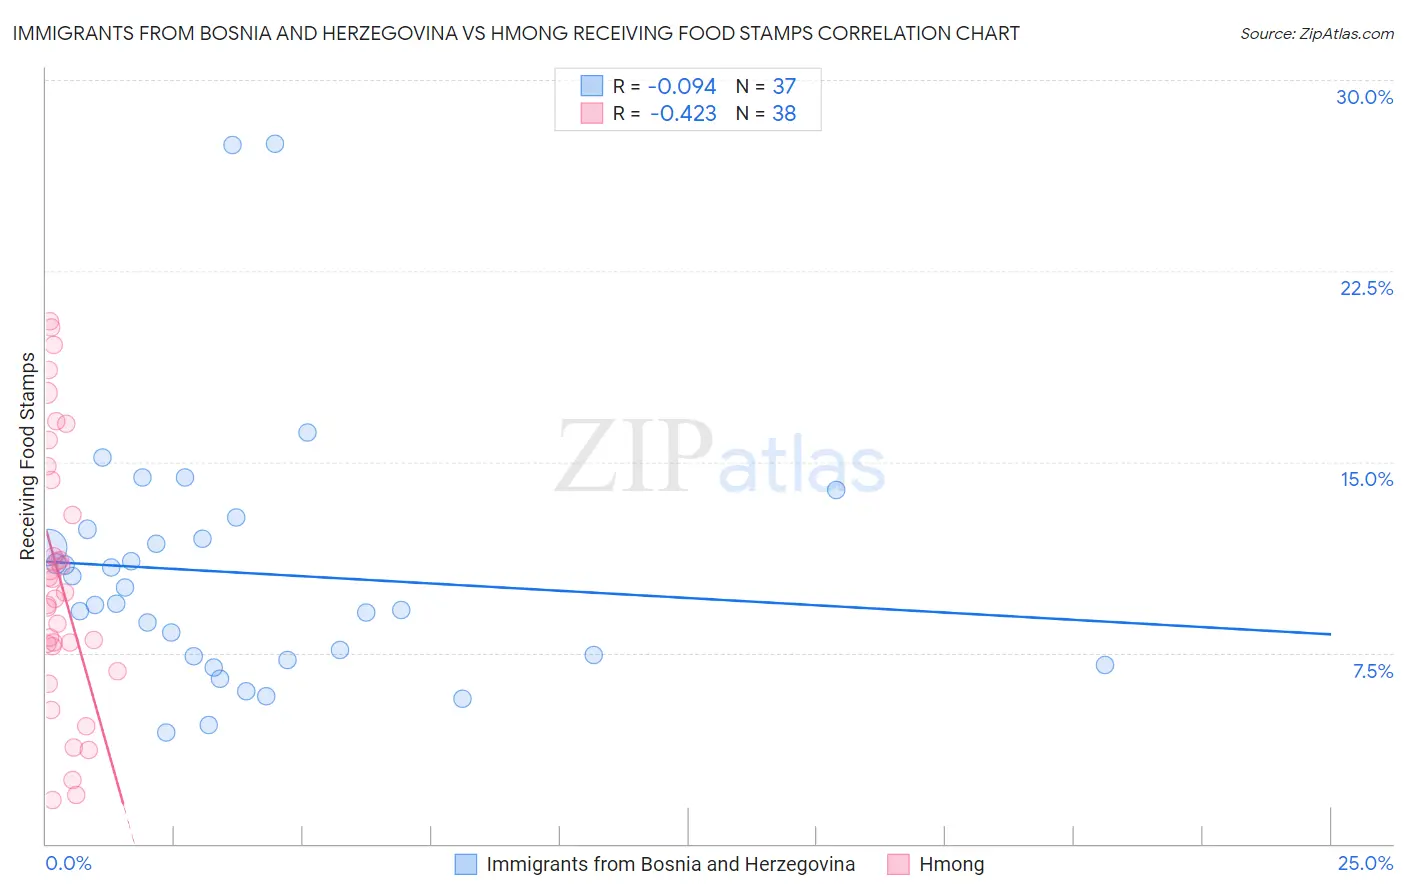
Immigrants from Bosnia and Herzegovina vs Hmong Receiving Food Stamps Correlation Chart
The statistical analysis conducted on geographies consisting of 156,646,102 people shows a slight negative correlation between the proportion of Immigrants from Bosnia and Herzegovina and percentage of population receiving government assistance and/or food stamps in the United States with a correlation coefficient (R) of -0.094 and weighted average of 11.3%. Similarly, the statistical analysis conducted on geographies consisting of 24,669,739 people shows a moderate negative correlation between the proportion of Hmong and percentage of population receiving government assistance and/or food stamps in the United States with a correlation coefficient (R) of -0.423 and weighted average of 10.9%, a difference of 4.0%.
Receiving Food Stamps Correlation Summary
| Measurement | Immigrants from Bosnia and Herzegovina | Hmong |
| Minimum | 4.4% | 1.7% |
| Maximum | 27.5% | 20.5% |
| Range | 23.1% | 18.8% |
| Mean | 10.6% | 10.4% |
| Median | 9.4% | 9.7% |
| Interquartile 25% (IQ1) | 7.3% | 7.8% |
| Interquartile 75% (IQ3) | 12.2% | 14.3% |
| Interquartile Range (IQR) | 4.9% | 6.5% |
| Standard Deviation (Sample) | 5.1% | 5.2% |
| Standard Deviation (Population) | 5.0% | 5.1% |
Demographics Similar to Immigrants from Bosnia and Herzegovina and Hmong by Receiving Food Stamps
In terms of receiving food stamps, the demographic groups most similar to Immigrants from Bosnia and Herzegovina are Immigrants from Lebanon (11.3%, a difference of 0.49%), Immigrants from Afghanistan (11.3%, a difference of 0.56%), Immigrants from Argentina (11.2%, a difference of 1.6%), Armenian (11.1%, a difference of 1.8%), and Lebanese (11.1%, a difference of 1.9%). Similarly, the demographic groups most similar to Hmong are Immigrants from Moldova (10.9%, a difference of 0.040%), Celtic (10.9%, a difference of 0.20%), Immigrants from Vietnam (11.0%, a difference of 0.56%), Chilean (11.0%, a difference of 0.73%), and Immigrants from Northern Africa (11.0%, a difference of 0.81%).
| Demographics | Rating | Rank | Receiving Food Stamps |
| Immigrants | Moldova | 88.5 /100 | #138 | Excellent 10.9% |
| Hmong | 88.4 /100 | #139 | Excellent 10.9% |
| Celtics | 87.8 /100 | #140 | Excellent 10.9% |
| Immigrants | Vietnam | 86.7 /100 | #141 | Excellent 11.0% |
| Chileans | 86.2 /100 | #142 | Excellent 11.0% |
| Immigrants | Northern Africa | 86.0 /100 | #143 | Excellent 11.0% |
| Syrians | 85.5 /100 | #144 | Excellent 11.0% |
| Hungarians | 85.1 /100 | #145 | Excellent 11.0% |
| Taiwanese | 84.2 /100 | #146 | Excellent 11.0% |
| Whites/Caucasians | 83.9 /100 | #147 | Excellent 11.1% |
| Immigrants | South Eastern Asia | 83.3 /100 | #148 | Excellent 11.1% |
| Brazilians | 83.2 /100 | #149 | Excellent 11.1% |
| Soviet Union | 83.1 /100 | #150 | Excellent 11.1% |
| Immigrants | Spain | 81.7 /100 | #151 | Excellent 11.1% |
| Immigrants | Kazakhstan | 81.7 /100 | #152 | Excellent 11.1% |
| Lebanese | 81.6 /100 | #153 | Excellent 11.1% |
| Armenians | 81.4 /100 | #154 | Excellent 11.1% |
| Immigrants | Argentina | 80.4 /100 | #155 | Excellent 11.2% |
| Immigrants | Afghanistan | 75.6 /100 | #156 | Good 11.3% |
| Immigrants | Lebanon | 75.2 /100 | #157 | Good 11.3% |
| Immigrants | Bosnia and Herzegovina | 72.6 /100 | #158 | Good 11.3% |