Immigrants from Bolivia vs Immigrants from Romania Bachelor's Degree
COMPARE
Immigrants from Bolivia
Immigrants from Romania
Bachelor's Degree
Bachelor's Degree Comparison
Immigrants from Bolivia
Immigrants from Romania
44.2%
BACHELOR'S DEGREE
99.9/ 100
METRIC RATING
55th/ 347
METRIC RANK
42.9%
BACHELOR'S DEGREE
99.6/ 100
METRIC RATING
70th/ 347
METRIC RANK
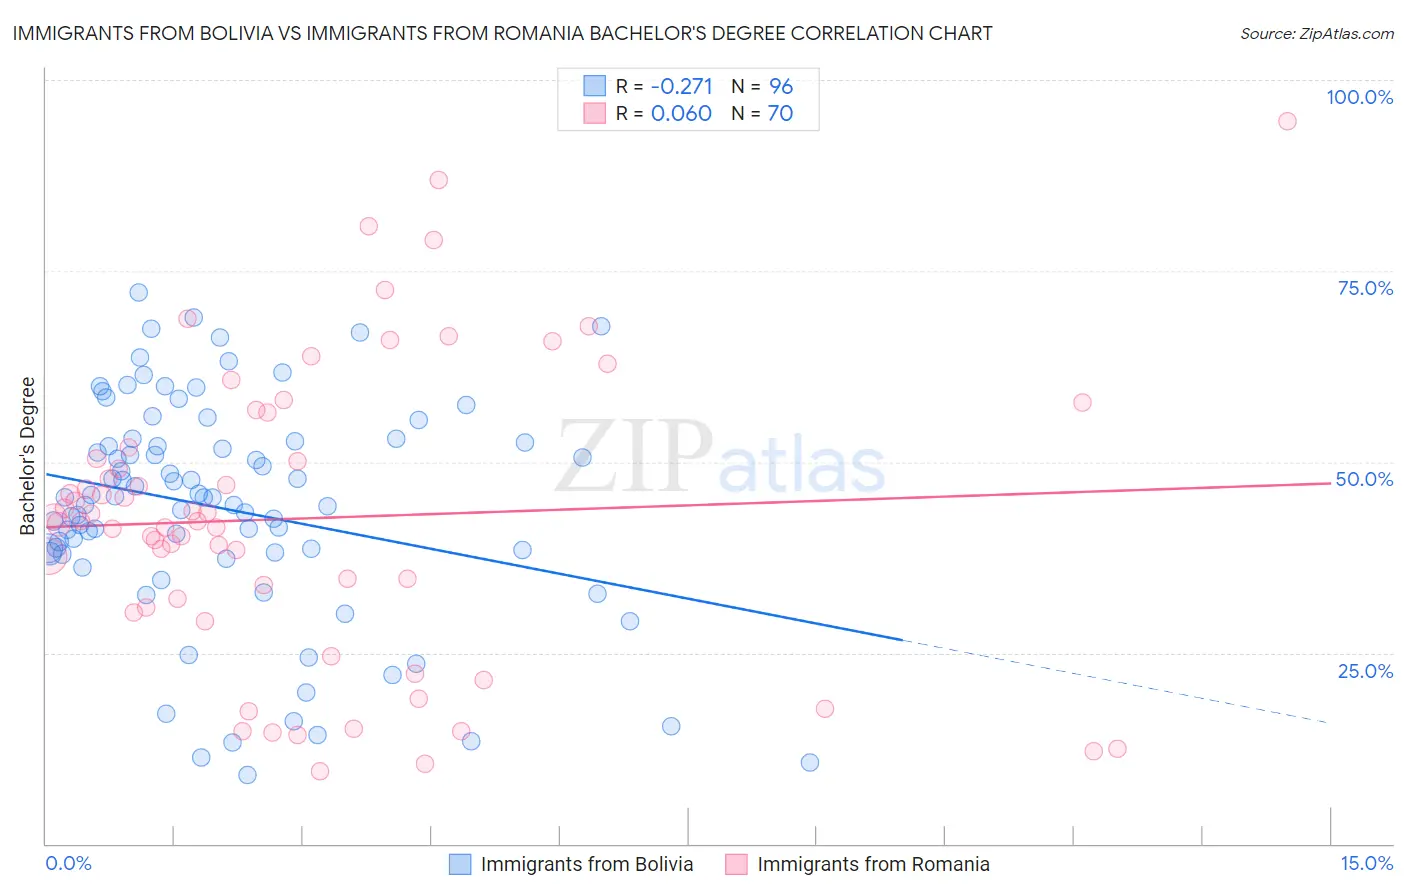
Immigrants from Bolivia vs Immigrants from Romania Bachelor's Degree Correlation Chart
The statistical analysis conducted on geographies consisting of 158,728,335 people shows a weak negative correlation between the proportion of Immigrants from Bolivia and percentage of population with at least bachelor's degree education in the United States with a correlation coefficient (R) of -0.271 and weighted average of 44.2%. Similarly, the statistical analysis conducted on geographies consisting of 257,014,107 people shows a slight positive correlation between the proportion of Immigrants from Romania and percentage of population with at least bachelor's degree education in the United States with a correlation coefficient (R) of 0.060 and weighted average of 42.9%, a difference of 3.0%.
Bachelor's Degree Correlation Summary
| Measurement | Immigrants from Bolivia | Immigrants from Romania |
| Minimum | 8.9% | 9.6% |
| Maximum | 72.2% | 94.5% |
| Range | 63.3% | 85.0% |
| Mean | 43.8% | 42.6% |
| Median | 45.3% | 42.3% |
| Interquartile 25% (IQ1) | 38.1% | 30.9% |
| Interquartile 75% (IQ3) | 52.6% | 51.9% |
| Interquartile Range (IQR) | 14.6% | 21.0% |
| Standard Deviation (Sample) | 14.6% | 19.2% |
| Standard Deviation (Population) | 14.5% | 19.1% |
Demographics Similar to Immigrants from Bolivia and Immigrants from Romania by Bachelor's Degree
In terms of bachelor's degree, the demographic groups most similar to Immigrants from Bolivia are Immigrants from Austria (44.2%, a difference of 0.0%), Immigrants from Serbia (44.1%, a difference of 0.18%), Immigrants from Asia (44.3%, a difference of 0.19%), Immigrants from Spain (44.3%, a difference of 0.25%), and Paraguayan (44.0%, a difference of 0.37%). Similarly, the demographic groups most similar to Immigrants from Romania are Immigrants from Argentina (42.8%, a difference of 0.26%), Ethiopian (42.8%, a difference of 0.35%), Immigrants from Pakistan (43.1%, a difference of 0.49%), Immigrants from Indonesia (43.3%, a difference of 0.75%), and Egyptian (43.3%, a difference of 0.77%).
| Demographics | Rating | Rank | Bachelor's Degree |
| Immigrants | Spain | 99.9 /100 | #52 | Exceptional 44.3% |
| Immigrants | Asia | 99.9 /100 | #53 | Exceptional 44.3% |
| Immigrants | Austria | 99.9 /100 | #54 | Exceptional 44.2% |
| Immigrants | Bolivia | 99.9 /100 | #55 | Exceptional 44.2% |
| Immigrants | Serbia | 99.9 /100 | #56 | Exceptional 44.1% |
| Paraguayans | 99.9 /100 | #57 | Exceptional 44.0% |
| Immigrants | Czechoslovakia | 99.9 /100 | #58 | Exceptional 44.0% |
| Australians | 99.9 /100 | #59 | Exceptional 44.0% |
| New Zealanders | 99.9 /100 | #60 | Exceptional 44.0% |
| South Africans | 99.8 /100 | #61 | Exceptional 43.6% |
| Immigrants | Kazakhstan | 99.8 /100 | #62 | Exceptional 43.4% |
| Immigrants | Europe | 99.8 /100 | #63 | Exceptional 43.4% |
| Argentineans | 99.7 /100 | #64 | Exceptional 43.3% |
| Zimbabweans | 99.7 /100 | #65 | Exceptional 43.3% |
| Immigrants | Netherlands | 99.7 /100 | #66 | Exceptional 43.3% |
| Egyptians | 99.7 /100 | #67 | Exceptional 43.3% |
| Immigrants | Indonesia | 99.7 /100 | #68 | Exceptional 43.3% |
| Immigrants | Pakistan | 99.7 /100 | #69 | Exceptional 43.1% |
| Immigrants | Romania | 99.6 /100 | #70 | Exceptional 42.9% |
| Immigrants | Argentina | 99.6 /100 | #71 | Exceptional 42.8% |
| Ethiopians | 99.5 /100 | #72 | Exceptional 42.8% |