Immigrants from Belgium vs Tsimshian Child Poverty Among Boys Under 16
COMPARE
Immigrants from Belgium
Tsimshian
Child Poverty Among Boys Under 16
Child Poverty Among Boys Under 16 Comparison
Immigrants from Belgium
Tsimshian
14.4%
CHILD POVERTY AMONG BOYS UNDER 16
98.9/ 100
METRIC RATING
60th/ 347
METRIC RANK
16.4%
CHILD POVERTY AMONG BOYS UNDER 16
50.5/ 100
METRIC RATING
173rd/ 347
METRIC RANK
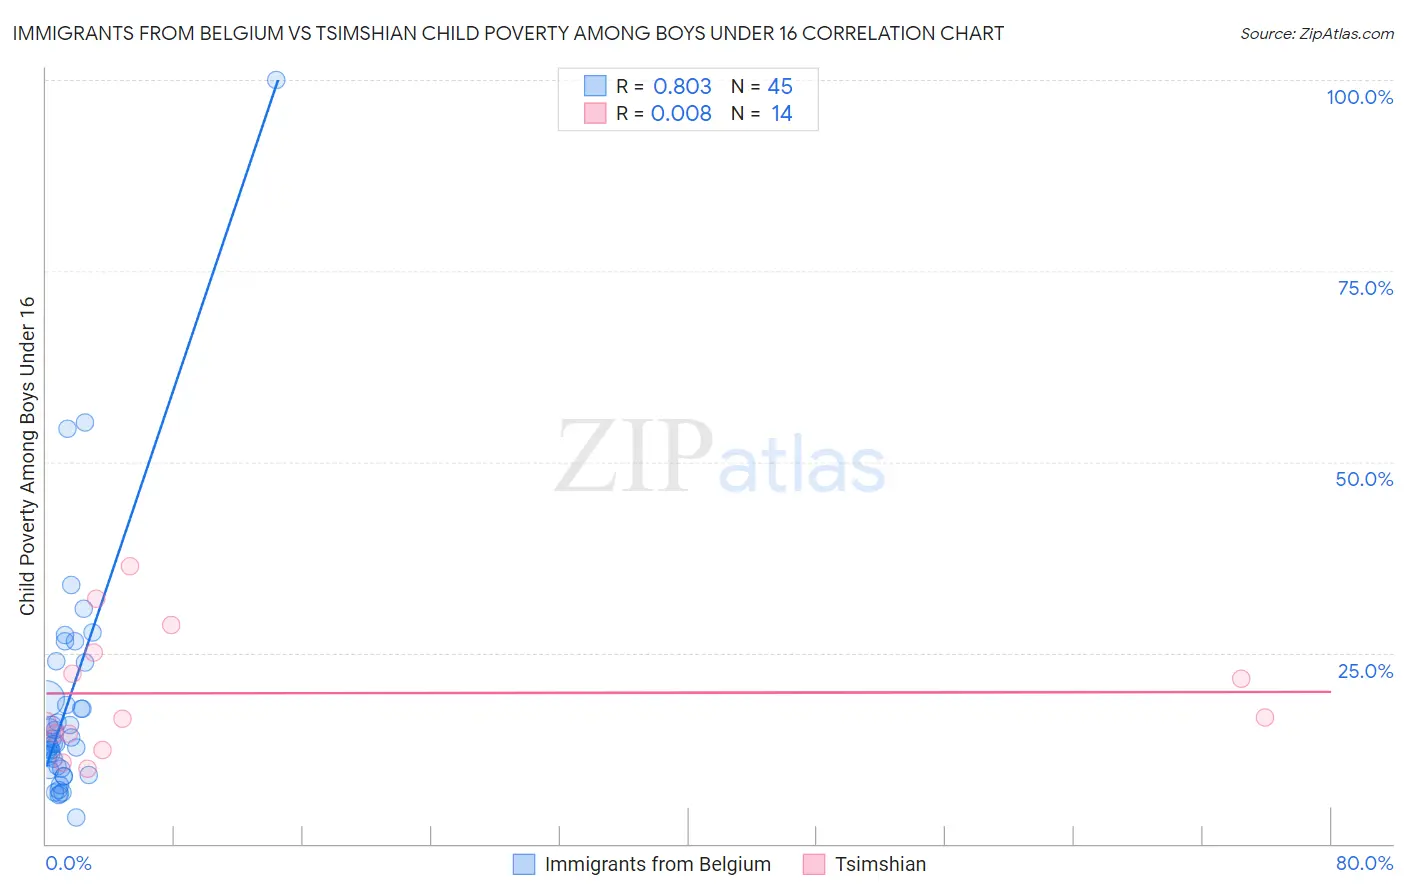
Immigrants from Belgium vs Tsimshian Child Poverty Among Boys Under 16 Correlation Chart
The statistical analysis conducted on geographies consisting of 145,199,128 people shows a very strong positive correlation between the proportion of Immigrants from Belgium and poverty level among boys under the age of 16 in the United States with a correlation coefficient (R) of 0.803 and weighted average of 14.4%. Similarly, the statistical analysis conducted on geographies consisting of 15,622,353 people shows no correlation between the proportion of Tsimshian and poverty level among boys under the age of 16 in the United States with a correlation coefficient (R) of 0.008 and weighted average of 16.4%, a difference of 14.2%.
Child Poverty Among Boys Under 16 Correlation Summary
| Measurement | Immigrants from Belgium | Tsimshian |
| Minimum | 3.5% | 9.9% |
| Maximum | 100.0% | 36.4% |
| Range | 96.5% | 26.5% |
| Mean | 18.5% | 19.7% |
| Median | 13.1% | 16.5% |
| Interquartile 25% (IQ1) | 9.8% | 14.3% |
| Interquartile 75% (IQ3) | 21.3% | 25.0% |
| Interquartile Range (IQR) | 11.6% | 10.7% |
| Standard Deviation (Sample) | 16.5% | 8.2% |
| Standard Deviation (Population) | 16.3% | 7.9% |
Similar Demographics by Child Poverty Among Boys Under 16
Demographics Similar to Immigrants from Belgium by Child Poverty Among Boys Under 16
In terms of child poverty among boys under 16, the demographic groups most similar to Immigrants from Belgium are Immigrants from Czechoslovakia (14.4%, a difference of 0.020%), Immigrants from Sweden (14.4%, a difference of 0.040%), Polish (14.4%, a difference of 0.12%), Scandinavian (14.4%, a difference of 0.12%), and Zimbabwean (14.3%, a difference of 0.22%).
| Demographics | Rating | Rank | Child Poverty Among Boys Under 16 |
| Immigrants | Philippines | 99.0 /100 | #53 | Exceptional 14.3% |
| Immigrants | Serbia | 99.0 /100 | #54 | Exceptional 14.3% |
| Immigrants | Pakistan | 99.0 /100 | #55 | Exceptional 14.3% |
| Zimbabweans | 99.0 /100 | #56 | Exceptional 14.3% |
| Poles | 98.9 /100 | #57 | Exceptional 14.4% |
| Immigrants | Sweden | 98.9 /100 | #58 | Exceptional 14.4% |
| Immigrants | Czechoslovakia | 98.9 /100 | #59 | Exceptional 14.4% |
| Immigrants | Belgium | 98.9 /100 | #60 | Exceptional 14.4% |
| Scandinavians | 98.8 /100 | #61 | Exceptional 14.4% |
| Immigrants | Israel | 98.7 /100 | #62 | Exceptional 14.4% |
| Cambodians | 98.5 /100 | #63 | Exceptional 14.5% |
| Immigrants | Romania | 98.5 /100 | #64 | Exceptional 14.5% |
| Soviet Union | 98.5 /100 | #65 | Exceptional 14.5% |
| Immigrants | Bulgaria | 98.5 /100 | #66 | Exceptional 14.5% |
| Immigrants | Europe | 98.4 /100 | #67 | Exceptional 14.5% |
Demographics Similar to Tsimshian by Child Poverty Among Boys Under 16
In terms of child poverty among boys under 16, the demographic groups most similar to Tsimshian are Immigrants from Colombia (16.4%, a difference of 0.030%), Uruguayan (16.4%, a difference of 0.060%), Immigrants from Ethiopia (16.4%, a difference of 0.080%), Immigrants from Bosnia and Herzegovina (16.4%, a difference of 0.14%), and Immigrants from Syria (16.5%, a difference of 0.16%).
| Demographics | Rating | Rank | Child Poverty Among Boys Under 16 |
| Immigrants | Germany | 63.6 /100 | #166 | Good 16.2% |
| Afghans | 55.4 /100 | #167 | Average 16.3% |
| South Americans | 55.3 /100 | #168 | Average 16.3% |
| Immigrants | Saudi Arabia | 53.6 /100 | #169 | Average 16.4% |
| Immigrants | Bosnia and Herzegovina | 51.7 /100 | #170 | Average 16.4% |
| Immigrants | Ethiopia | 51.3 /100 | #171 | Average 16.4% |
| Immigrants | Colombia | 50.8 /100 | #172 | Average 16.4% |
| Tsimshian | 50.5 /100 | #173 | Average 16.4% |
| Uruguayans | 50.0 /100 | #174 | Average 16.4% |
| Immigrants | Syria | 49.0 /100 | #175 | Average 16.5% |
| Whites/Caucasians | 48.2 /100 | #176 | Average 16.5% |
| Ethiopians | 47.8 /100 | #177 | Average 16.5% |
| Scotch-Irish | 47.5 /100 | #178 | Average 16.5% |
| Hungarians | 47.3 /100 | #179 | Average 16.5% |
| Hawaiians | 45.5 /100 | #180 | Average 16.5% |