Immigrants from Belgium vs Tsimshian Unemployment Among Ages 30 to 34 years
COMPARE
Immigrants from Belgium
Tsimshian
Unemployment Among Ages 30 to 34 years
Unemployment Among Ages 30 to 34 years Comparison
Immigrants from Belgium
Tsimshian
5.1%
UNEMPLOYMENT AMONG AGES 30 TO 34 YEARS
98.7/ 100
METRIC RATING
44th/ 347
METRIC RANK
13.8%
UNEMPLOYMENT AMONG AGES 30 TO 34 YEARS
0.0/ 100
METRIC RATING
346th/ 347
METRIC RANK
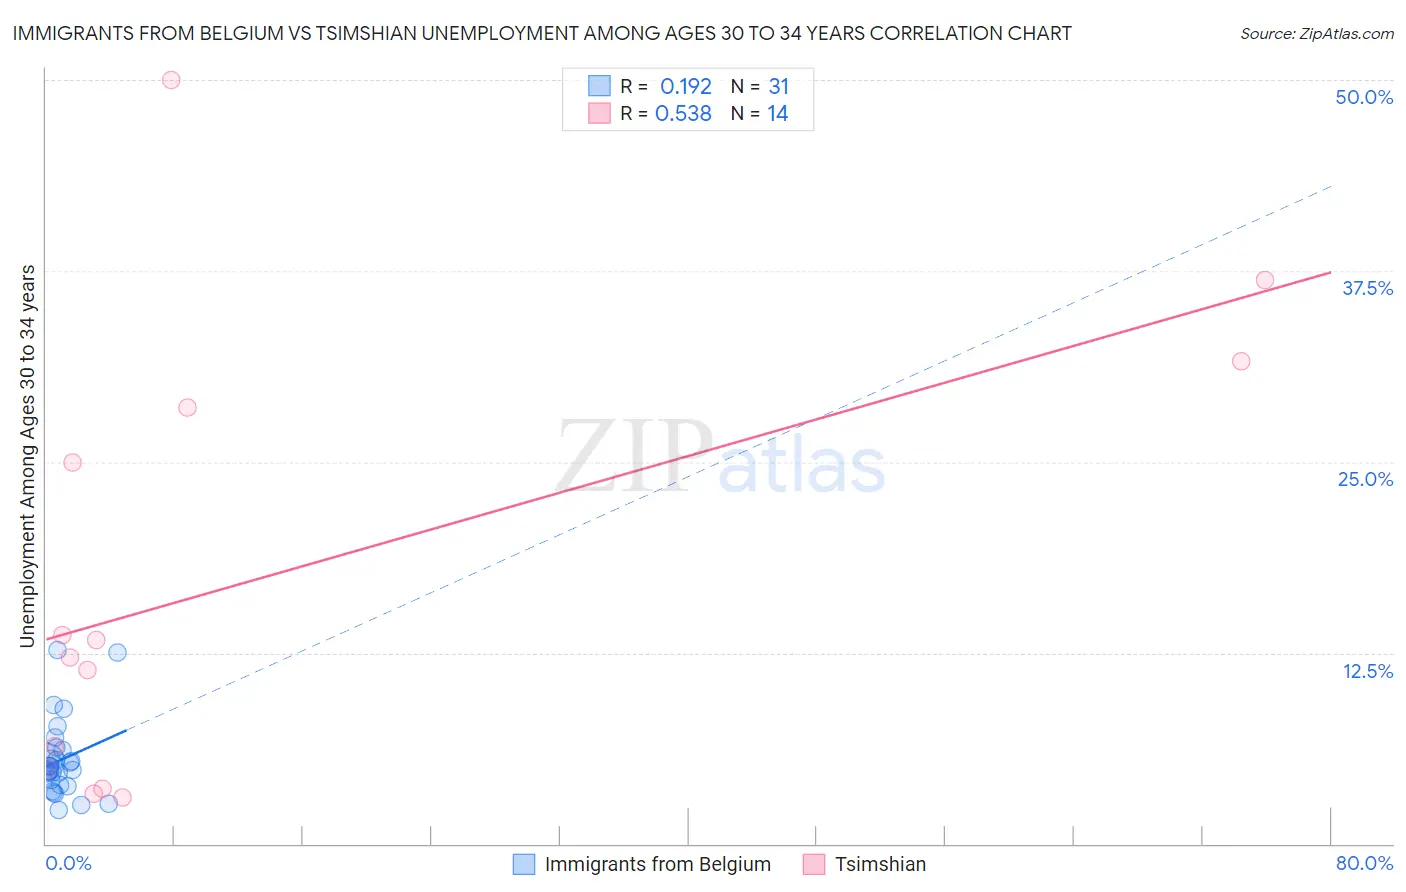
Immigrants from Belgium vs Tsimshian Unemployment Among Ages 30 to 34 years Correlation Chart
The statistical analysis conducted on geographies consisting of 142,059,872 people shows a poor positive correlation between the proportion of Immigrants from Belgium and unemployment rate among population between the ages 30 and 34 in the United States with a correlation coefficient (R) of 0.192 and weighted average of 5.1%. Similarly, the statistical analysis conducted on geographies consisting of 15,527,630 people shows a substantial positive correlation between the proportion of Tsimshian and unemployment rate among population between the ages 30 and 34 in the United States with a correlation coefficient (R) of 0.538 and weighted average of 13.8%, a difference of 172.4%.
Unemployment Among Ages 30 to 34 years Correlation Summary
| Measurement | Immigrants from Belgium | Tsimshian |
| Minimum | 2.2% | 3.0% |
| Maximum | 12.7% | 50.0% |
| Range | 10.5% | 47.0% |
| Mean | 5.5% | 17.4% |
| Median | 5.1% | 12.7% |
| Interquartile 25% (IQ1) | 3.9% | 4.9% |
| Interquartile 75% (IQ3) | 6.1% | 28.6% |
| Interquartile Range (IQR) | 2.2% | 23.7% |
| Standard Deviation (Sample) | 2.5% | 14.7% |
| Standard Deviation (Population) | 2.4% | 14.1% |
Similar Demographics by Unemployment Among Ages 30 to 34 years
Demographics Similar to Immigrants from Belgium by Unemployment Among Ages 30 to 34 years
In terms of unemployment among ages 30 to 34 years, the demographic groups most similar to Immigrants from Belgium are Yugoslavian (5.1%, a difference of 0.030%), Soviet Union (5.0%, a difference of 0.14%), Immigrants from Hong Kong (5.0%, a difference of 0.25%), Immigrants from Congo (5.1%, a difference of 0.33%), and Cypriot (5.1%, a difference of 0.36%).
| Demographics | Rating | Rank | Unemployment Among Ages 30 to 34 years |
| Immigrants | Turkey | 99.0 /100 | #37 | Exceptional 5.0% |
| Sri Lankans | 99.0 /100 | #38 | Exceptional 5.0% |
| Fijians | 99.0 /100 | #39 | Exceptional 5.0% |
| Immigrants | Vietnam | 98.9 /100 | #40 | Exceptional 5.0% |
| Immigrants | Eastern Africa | 98.9 /100 | #41 | Exceptional 5.0% |
| Immigrants | Hong Kong | 98.8 /100 | #42 | Exceptional 5.0% |
| Soviet Union | 98.8 /100 | #43 | Exceptional 5.0% |
| Immigrants | Belgium | 98.7 /100 | #44 | Exceptional 5.1% |
| Yugoslavians | 98.6 /100 | #45 | Exceptional 5.1% |
| Immigrants | Congo | 98.4 /100 | #46 | Exceptional 5.1% |
| Cypriots | 98.4 /100 | #47 | Exceptional 5.1% |
| Assyrians/Chaldeans/Syriacs | 98.4 /100 | #48 | Exceptional 5.1% |
| Immigrants | Malaysia | 98.3 /100 | #49 | Exceptional 5.1% |
| Puget Sound Salish | 98.2 /100 | #50 | Exceptional 5.1% |
| Turks | 98.2 /100 | #51 | Exceptional 5.1% |
Demographics Similar to Tsimshian by Unemployment Among Ages 30 to 34 years
In terms of unemployment among ages 30 to 34 years, the demographic groups most similar to Tsimshian are Arapaho (12.8%, a difference of 7.4%), Hopi (11.9%, a difference of 15.3%), Inupiat (10.8%, a difference of 27.2%), Yuman (10.6%, a difference of 29.9%), and Navajo (10.6%, a difference of 30.4%).
| Demographics | Rating | Rank | Unemployment Among Ages 30 to 34 years |
| Pueblo | 0.0 /100 | #333 | Tragic 8.3% |
| Alaska Natives | 0.0 /100 | #334 | Tragic 8.5% |
| Puerto Ricans | 0.0 /100 | #335 | Tragic 8.9% |
| Colville | 0.0 /100 | #336 | Tragic 9.0% |
| Pima | 0.0 /100 | #337 | Tragic 9.6% |
| Yakama | 0.0 /100 | #338 | Tragic 9.8% |
| Tohono O'odham | 0.0 /100 | #339 | Tragic 9.8% |
| Crow | 0.0 /100 | #340 | Tragic 10.3% |
| Navajo | 0.0 /100 | #341 | Tragic 10.6% |
| Yuman | 0.0 /100 | #342 | Tragic 10.6% |
| Inupiat | 0.0 /100 | #343 | Tragic 10.8% |
| Hopi | 0.0 /100 | #344 | Tragic 11.9% |
| Arapaho | 0.0 /100 | #345 | Tragic 12.8% |
| Tsimshian | 0.0 /100 | #346 | Tragic 13.8% |
| Yup'ik | 0.0 /100 | #347 | Tragic 18.5% |