Immigrants from Belgium vs Senegalese Seniors Poverty Over the Age of 75
COMPARE
Immigrants from Belgium
Senegalese
Seniors Poverty Over the Age of 75
Seniors Poverty Over the Age of 75 Comparison
Immigrants from Belgium
Senegalese
12.0%
SENIORS POVERTY OVER THE AGE OF 75
70.8/ 100
METRIC RATING
145th/ 347
METRIC RANK
14.5%
SENIORS POVERTY OVER THE AGE OF 75
0.0/ 100
METRIC RATING
277th/ 347
METRIC RANK
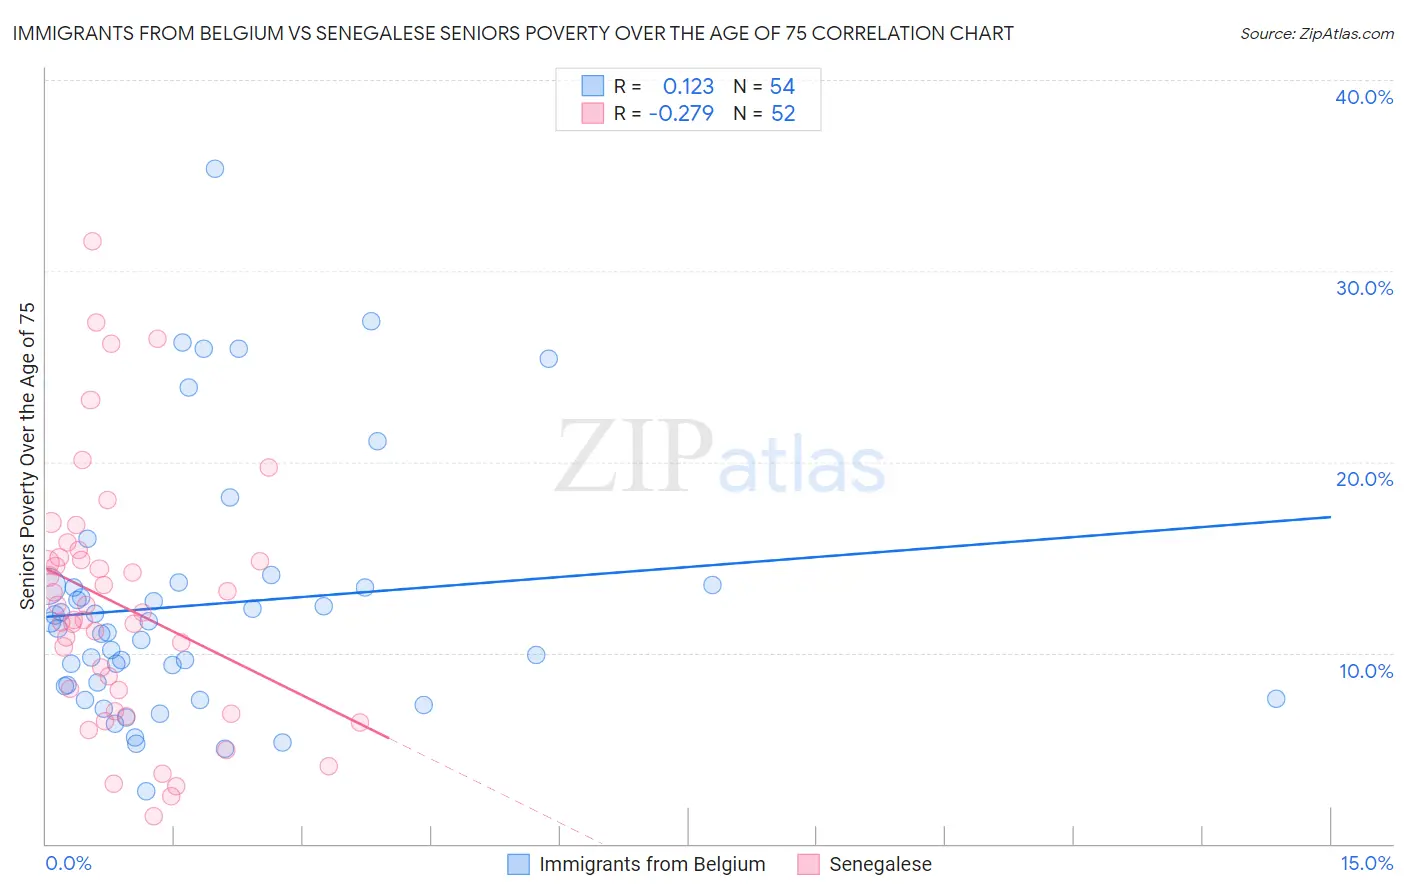
Immigrants from Belgium vs Senegalese Seniors Poverty Over the Age of 75 Correlation Chart
The statistical analysis conducted on geographies consisting of 145,882,918 people shows a poor positive correlation between the proportion of Immigrants from Belgium and poverty level among seniors over the age of 75 in the United States with a correlation coefficient (R) of 0.123 and weighted average of 12.0%. Similarly, the statistical analysis conducted on geographies consisting of 77,878,281 people shows a weak negative correlation between the proportion of Senegalese and poverty level among seniors over the age of 75 in the United States with a correlation coefficient (R) of -0.279 and weighted average of 14.5%, a difference of 21.2%.
Seniors Poverty Over the Age of 75 Correlation Summary
| Measurement | Immigrants from Belgium | Senegalese |
| Minimum | 2.7% | 1.5% |
| Maximum | 35.4% | 31.6% |
| Range | 32.6% | 30.1% |
| Mean | 12.5% | 12.5% |
| Median | 11.2% | 11.9% |
| Interquartile 25% (IQ1) | 8.3% | 7.5% |
| Interquartile 75% (IQ3) | 13.5% | 14.9% |
| Interquartile Range (IQR) | 5.2% | 7.5% |
| Standard Deviation (Sample) | 6.7% | 6.6% |
| Standard Deviation (Population) | 6.6% | 6.5% |
Similar Demographics by Seniors Poverty Over the Age of 75
Demographics Similar to Immigrants from Belgium by Seniors Poverty Over the Age of 75
In terms of seniors poverty over the age of 75, the demographic groups most similar to Immigrants from Belgium are Hmong (12.0%, a difference of 0.0%), American (12.0%, a difference of 0.010%), Bangladeshi (12.0%, a difference of 0.050%), Immigrants from Laos (12.0%, a difference of 0.060%), and Immigrants from Cameroon (12.0%, a difference of 0.090%).
| Demographics | Rating | Rank | Seniors Poverty Over the Age of 75 |
| Immigrants | Romania | 72.6 /100 | #138 | Good 11.9% |
| Immigrants | Kenya | 72.6 /100 | #139 | Good 11.9% |
| Immigrants | Pakistan | 71.9 /100 | #140 | Good 12.0% |
| Immigrants | Cameroon | 71.7 /100 | #141 | Good 12.0% |
| Immigrants | Laos | 71.5 /100 | #142 | Good 12.0% |
| Americans | 71.0 /100 | #143 | Good 12.0% |
| Hmong | 70.8 /100 | #144 | Good 12.0% |
| Immigrants | Belgium | 70.8 /100 | #145 | Good 12.0% |
| Bangladeshis | 70.4 /100 | #146 | Good 12.0% |
| Immigrants | Latvia | 69.1 /100 | #147 | Good 12.0% |
| Immigrants | Zaire | 67.6 /100 | #148 | Good 12.0% |
| Asians | 67.4 /100 | #149 | Good 12.0% |
| Cypriots | 67.3 /100 | #150 | Good 12.0% |
| Cherokee | 65.8 /100 | #151 | Good 12.0% |
| Immigrants | Korea | 65.5 /100 | #152 | Good 12.0% |
Demographics Similar to Senegalese by Seniors Poverty Over the Age of 75
In terms of seniors poverty over the age of 75, the demographic groups most similar to Senegalese are Soviet Union (14.5%, a difference of 0.27%), Immigrants from El Salvador (14.5%, a difference of 0.32%), Immigrants from Bahamas (14.4%, a difference of 0.49%), Immigrants from South America (14.4%, a difference of 0.65%), and Immigrants from Colombia (14.6%, a difference of 0.77%).
| Demographics | Rating | Rank | Seniors Poverty Over the Age of 75 |
| Immigrants | Uruguay | 0.0 /100 | #270 | Tragic 14.3% |
| Immigrants | Ghana | 0.0 /100 | #271 | Tragic 14.4% |
| Mexicans | 0.0 /100 | #272 | Tragic 14.4% |
| Immigrants | South America | 0.0 /100 | #273 | Tragic 14.4% |
| Immigrants | Bahamas | 0.0 /100 | #274 | Tragic 14.4% |
| Immigrants | El Salvador | 0.0 /100 | #275 | Tragic 14.5% |
| Soviet Union | 0.0 /100 | #276 | Tragic 14.5% |
| Senegalese | 0.0 /100 | #277 | Tragic 14.5% |
| Immigrants | Colombia | 0.0 /100 | #278 | Tragic 14.6% |
| Blacks/African Americans | 0.0 /100 | #279 | Tragic 14.6% |
| Central Americans | 0.0 /100 | #280 | Tragic 14.7% |
| Belizeans | 0.0 /100 | #281 | Tragic 14.8% |
| Immigrants | Senegal | 0.0 /100 | #282 | Tragic 14.8% |
| Guatemalans | 0.0 /100 | #283 | Tragic 14.8% |
| Cheyenne | 0.0 /100 | #284 | Tragic 14.9% |