Mexican American Indian vs Immigrants from Middle Africa Poverty
COMPARE
Mexican American Indian
Immigrants from Middle Africa
Poverty
Poverty Comparison
Mexican American Indians
Immigrants from Middle Africa
14.3%
POVERTY
0.1/ 100
METRIC RATING
256th/ 347
METRIC RANK
14.0%
POVERTY
0.4/ 100
METRIC RATING
240th/ 347
METRIC RANK
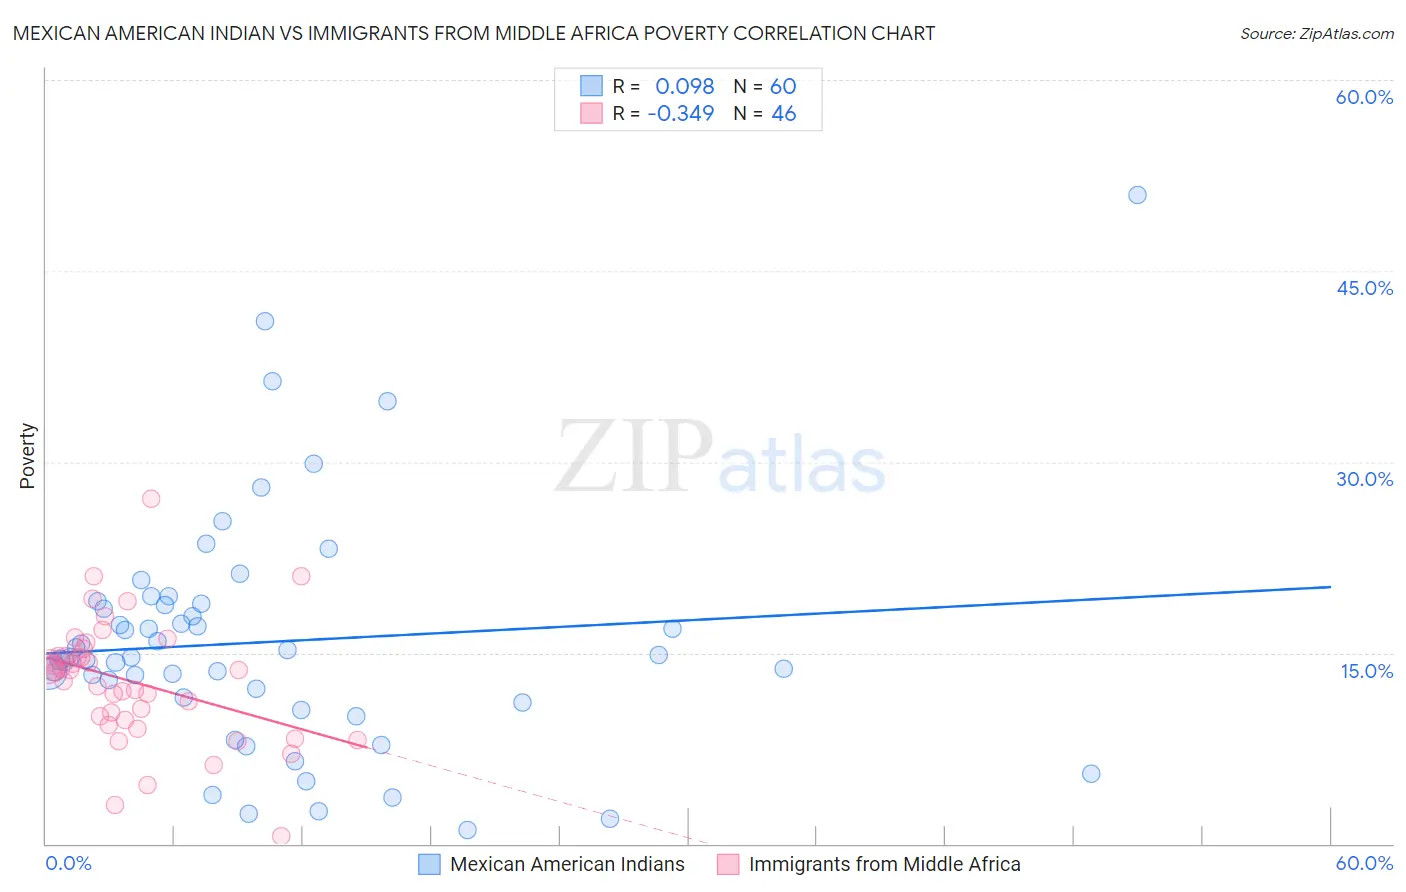
Mexican American Indian vs Immigrants from Middle Africa Poverty Correlation Chart
The statistical analysis conducted on geographies consisting of 317,505,642 people shows a slight positive correlation between the proportion of Mexican American Indians and poverty level in the United States with a correlation coefficient (R) of 0.098 and weighted average of 14.3%. Similarly, the statistical analysis conducted on geographies consisting of 202,643,852 people shows a mild negative correlation between the proportion of Immigrants from Middle Africa and poverty level in the United States with a correlation coefficient (R) of -0.349 and weighted average of 14.0%, a difference of 2.4%.
Poverty Correlation Summary
| Measurement | Mexican American Indian | Immigrants from Middle Africa |
| Minimum | 1.1% | 0.62% |
| Maximum | 51.0% | 27.1% |
| Range | 49.9% | 26.5% |
| Mean | 15.9% | 12.8% |
| Median | 14.6% | 13.6% |
| Interquartile 25% (IQ1) | 11.3% | 9.7% |
| Interquartile 75% (IQ3) | 18.8% | 14.7% |
| Interquartile Range (IQR) | 7.5% | 5.0% |
| Standard Deviation (Sample) | 9.3% | 4.9% |
| Standard Deviation (Population) | 9.2% | 4.8% |
Demographics Similar to Mexican American Indians and Immigrants from Middle Africa by Poverty
In terms of poverty, the demographic groups most similar to Mexican American Indians are Immigrants from Ecuador (14.3%, a difference of 0.020%), Trinidadian and Tobagonian (14.3%, a difference of 0.040%), Ottawa (14.3%, a difference of 0.050%), Immigrants from El Salvador (14.3%, a difference of 0.11%), and Immigrants from Trinidad and Tobago (14.2%, a difference of 0.37%). Similarly, the demographic groups most similar to Immigrants from Middle Africa are Salvadoran (14.0%, a difference of 0.020%), Nicaraguan (13.9%, a difference of 0.12%), Ecuadorian (14.0%, a difference of 0.34%), Sudanese (14.0%, a difference of 0.41%), and Nepalese (14.0%, a difference of 0.44%).
| Demographics | Rating | Rank | Poverty |
| Ghanaians | 0.5 /100 | #238 | Tragic 13.9% |
| Nicaraguans | 0.4 /100 | #239 | Tragic 13.9% |
| Immigrants | Middle Africa | 0.4 /100 | #240 | Tragic 14.0% |
| Salvadorans | 0.4 /100 | #241 | Tragic 14.0% |
| Ecuadorians | 0.4 /100 | #242 | Tragic 14.0% |
| Sudanese | 0.3 /100 | #243 | Tragic 14.0% |
| Nepalese | 0.3 /100 | #244 | Tragic 14.0% |
| Immigrants | Sudan | 0.3 /100 | #245 | Tragic 14.1% |
| Potawatomi | 0.3 /100 | #246 | Tragic 14.1% |
| Liberians | 0.2 /100 | #247 | Tragic 14.1% |
| Immigrants | Western Africa | 0.2 /100 | #248 | Tragic 14.1% |
| Immigrants | Ghana | 0.2 /100 | #249 | Tragic 14.2% |
| Cree | 0.2 /100 | #250 | Tragic 14.2% |
| Immigrants | Burma/Myanmar | 0.2 /100 | #251 | Tragic 14.2% |
| Spanish American Indians | 0.2 /100 | #252 | Tragic 14.2% |
| Immigrants | Trinidad and Tobago | 0.2 /100 | #253 | Tragic 14.2% |
| Immigrants | El Salvador | 0.1 /100 | #254 | Tragic 14.3% |
| Immigrants | Ecuador | 0.1 /100 | #255 | Tragic 14.3% |
| Mexican American Indians | 0.1 /100 | #256 | Tragic 14.3% |
| Trinidadians and Tobagonians | 0.1 /100 | #257 | Tragic 14.3% |
| Ottawa | 0.1 /100 | #258 | Tragic 14.3% |