Samoan vs Finnish Child Poverty Under the Age of 16
COMPARE
Samoan
Finnish
Child Poverty Under the Age of 16
Child Poverty Under the Age of 16 Comparison
Samoans
Finns
15.6%
CHILD POVERTY UNDER THE AGE OF 16
77.3/ 100
METRIC RATING
154th/ 347
METRIC RANK
14.5%
CHILD POVERTY UNDER THE AGE OF 16
97.2/ 100
METRIC RATING
81st/ 347
METRIC RANK
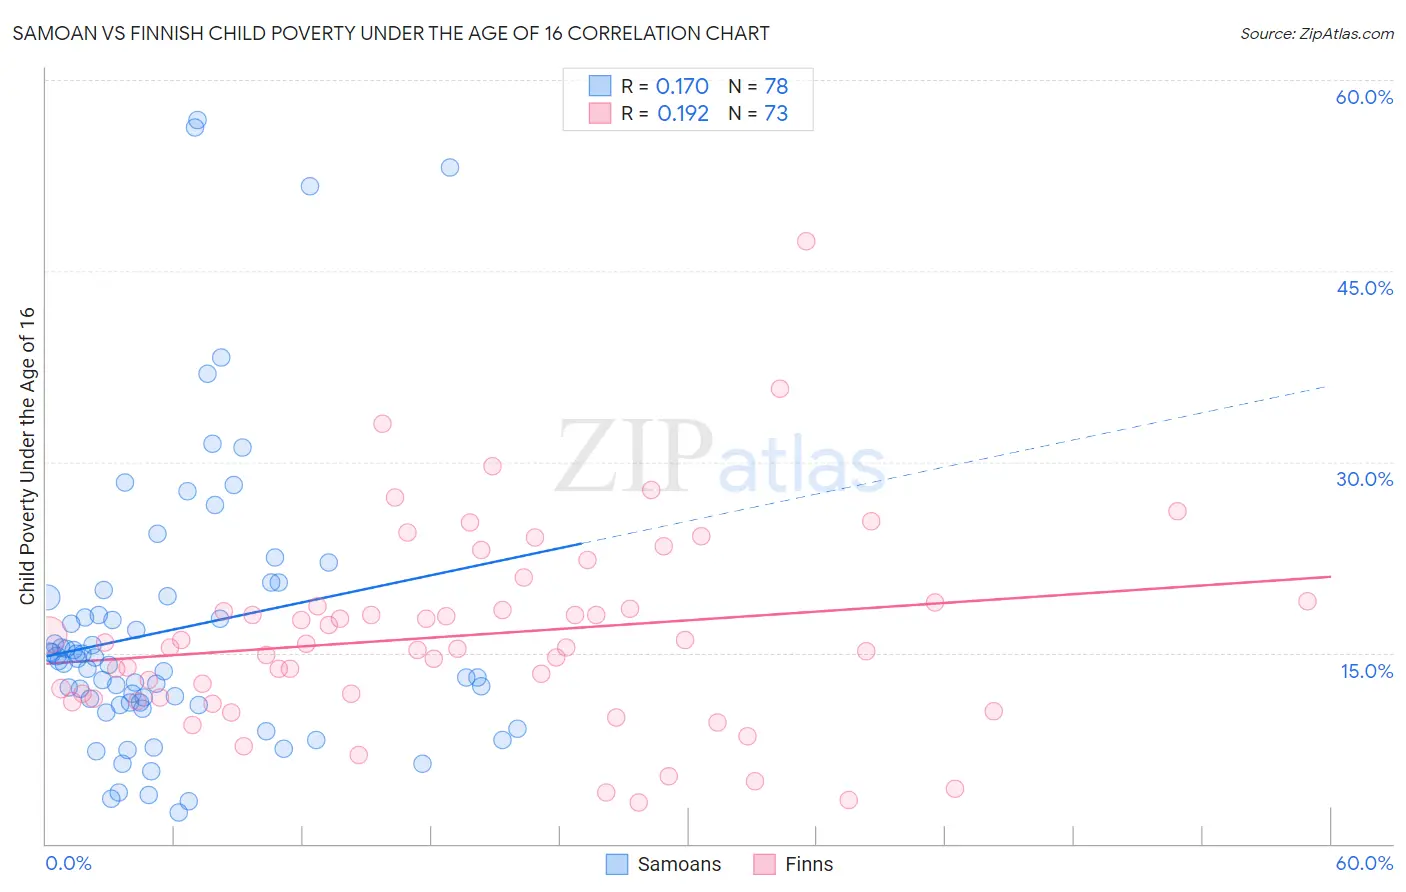
Samoan vs Finnish Child Poverty Under the Age of 16 Correlation Chart
The statistical analysis conducted on geographies consisting of 224,526,833 people shows a poor positive correlation between the proportion of Samoans and poverty level among children under the age of 16 in the United States with a correlation coefficient (R) of 0.170 and weighted average of 15.6%. Similarly, the statistical analysis conducted on geographies consisting of 399,880,934 people shows a poor positive correlation between the proportion of Finns and poverty level among children under the age of 16 in the United States with a correlation coefficient (R) of 0.192 and weighted average of 14.5%, a difference of 7.8%.
Child Poverty Under the Age of 16 Correlation Summary
| Measurement | Samoan | Finnish |
| Minimum | 2.5% | 3.2% |
| Maximum | 56.8% | 47.4% |
| Range | 54.4% | 44.1% |
| Mean | 16.9% | 16.4% |
| Median | 14.3% | 15.4% |
| Interquartile 25% (IQ1) | 10.9% | 11.4% |
| Interquartile 75% (IQ3) | 19.4% | 18.8% |
| Interquartile Range (IQR) | 8.5% | 7.4% |
| Standard Deviation (Sample) | 11.4% | 7.7% |
| Standard Deviation (Population) | 11.4% | 7.7% |
Similar Demographics by Child Poverty Under the Age of 16
Demographics Similar to Samoans by Child Poverty Under the Age of 16
In terms of child poverty under the age of 16, the demographic groups most similar to Samoans are Venezuelan (15.6%, a difference of 0.030%), French Canadian (15.6%, a difference of 0.18%), Syrian (15.6%, a difference of 0.21%), Immigrants from Jordan (15.6%, a difference of 0.22%), and French (15.6%, a difference of 0.22%).
| Demographics | Rating | Rank | Child Poverty Under the Age of 16 |
| Immigrants | Kuwait | 80.5 /100 | #147 | Excellent 15.5% |
| Puget Sound Salish | 80.3 /100 | #148 | Excellent 15.5% |
| Israelis | 80.1 /100 | #149 | Excellent 15.5% |
| Immigrants | Jordan | 78.5 /100 | #150 | Good 15.6% |
| French | 78.5 /100 | #151 | Good 15.6% |
| French Canadians | 78.2 /100 | #152 | Good 15.6% |
| Venezuelans | 77.4 /100 | #153 | Good 15.6% |
| Samoans | 77.3 /100 | #154 | Good 15.6% |
| Syrians | 76.1 /100 | #155 | Good 15.6% |
| Immigrants | Venezuela | 74.9 /100 | #156 | Good 15.7% |
| Immigrants | Nepal | 72.9 /100 | #157 | Good 15.7% |
| Immigrants | Chile | 72.8 /100 | #158 | Good 15.7% |
| Immigrants | Fiji | 71.1 /100 | #159 | Good 15.8% |
| Immigrants | Albania | 70.7 /100 | #160 | Good 15.8% |
| Immigrants | Northern Africa | 68.1 /100 | #161 | Good 15.8% |
Demographics Similar to Finns by Child Poverty Under the Age of 16
In terms of child poverty under the age of 16, the demographic groups most similar to Finns are Immigrants from North Macedonia (14.5%, a difference of 0.030%), Immigrants from Canada (14.5%, a difference of 0.030%), Egyptian (14.5%, a difference of 0.060%), Immigrants from Latvia (14.5%, a difference of 0.080%), and Swiss (14.5%, a difference of 0.10%).
| Demographics | Rating | Rank | Child Poverty Under the Age of 16 |
| Macedonians | 97.6 /100 | #74 | Exceptional 14.4% |
| Ukrainians | 97.5 /100 | #75 | Exceptional 14.4% |
| Immigrants | Eastern Europe | 97.5 /100 | #76 | Exceptional 14.4% |
| Australians | 97.5 /100 | #77 | Exceptional 14.4% |
| Immigrants | Russia | 97.3 /100 | #78 | Exceptional 14.5% |
| Swiss | 97.3 /100 | #79 | Exceptional 14.5% |
| Immigrants | North Macedonia | 97.2 /100 | #80 | Exceptional 14.5% |
| Finns | 97.2 /100 | #81 | Exceptional 14.5% |
| Immigrants | Canada | 97.2 /100 | #82 | Exceptional 14.5% |
| Egyptians | 97.2 /100 | #83 | Exceptional 14.5% |
| Immigrants | Latvia | 97.1 /100 | #84 | Exceptional 14.5% |
| Soviet Union | 97.1 /100 | #85 | Exceptional 14.5% |
| Immigrants | Argentina | 97.1 /100 | #86 | Exceptional 14.5% |
| Taiwanese | 97.1 /100 | #87 | Exceptional 14.5% |
| Northern Europeans | 97.0 /100 | #88 | Exceptional 14.5% |