Immigrants from Barbados vs Immigrants from Costa Rica Unemployment Among Youth under 25 years
COMPARE
Immigrants from Barbados
Immigrants from Costa Rica
Unemployment Among Youth under 25 years
Unemployment Among Youth under 25 years Comparison
Immigrants from Barbados
Immigrants from Costa Rica
15.2%
UNEMPLOYMENT AMONG YOUTH UNDER 25 YEARS
0.0/ 100
METRIC RATING
326th/ 347
METRIC RANK
11.8%
UNEMPLOYMENT AMONG YOUTH UNDER 25 YEARS
15.2/ 100
METRIC RATING
204th/ 347
METRIC RANK
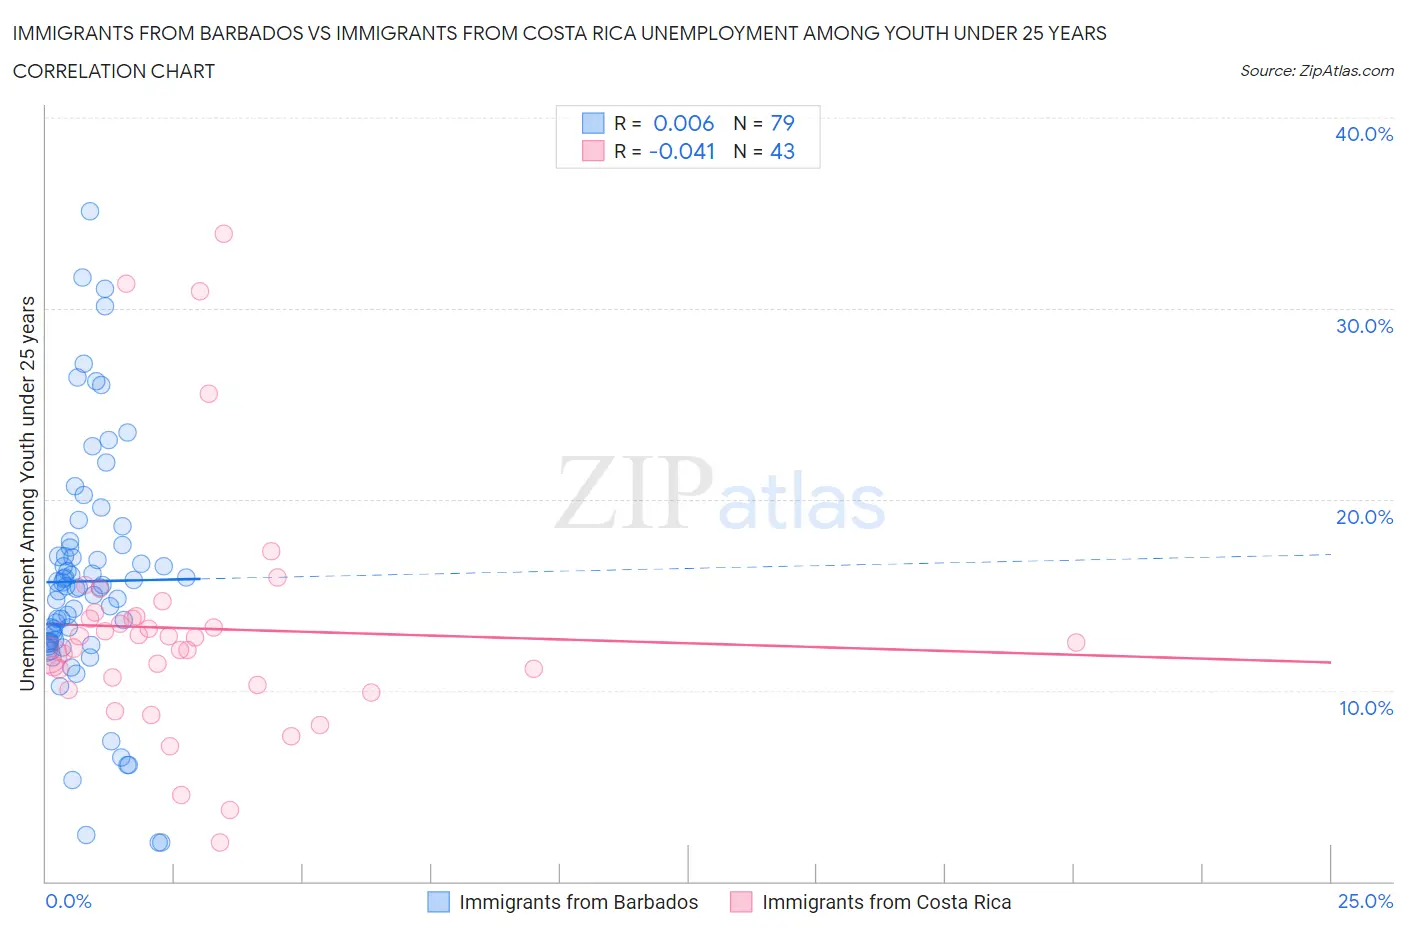
Immigrants from Barbados vs Immigrants from Costa Rica Unemployment Among Youth under 25 years Correlation Chart
The statistical analysis conducted on geographies consisting of 112,488,242 people shows no correlation between the proportion of Immigrants from Barbados and unemployment rate among youth under the age of 25 in the United States with a correlation coefficient (R) of 0.006 and weighted average of 15.2%. Similarly, the statistical analysis conducted on geographies consisting of 203,462,703 people shows no correlation between the proportion of Immigrants from Costa Rica and unemployment rate among youth under the age of 25 in the United States with a correlation coefficient (R) of -0.041 and weighted average of 11.8%, a difference of 29.0%.
Unemployment Among Youth under 25 years Correlation Summary
| Measurement | Immigrants from Barbados | Immigrants from Costa Rica |
| Minimum | 2.0% | 2.0% |
| Maximum | 35.1% | 33.9% |
| Range | 33.1% | 31.9% |
| Mean | 15.7% | 13.2% |
| Median | 15.4% | 12.5% |
| Interquartile 25% (IQ1) | 12.5% | 10.3% |
| Interquartile 75% (IQ3) | 17.5% | 13.9% |
| Interquartile Range (IQR) | 5.0% | 3.6% |
| Standard Deviation (Sample) | 6.3% | 6.4% |
| Standard Deviation (Population) | 6.3% | 6.4% |
Similar Demographics by Unemployment Among Youth under 25 years
Demographics Similar to Immigrants from Barbados by Unemployment Among Youth under 25 years
In terms of unemployment among youth under 25 years, the demographic groups most similar to Immigrants from Barbados are British West Indian (15.5%, a difference of 2.1%), Immigrants from Dominican Republic (15.6%, a difference of 2.2%), Alaska Native (14.9%, a difference of 2.2%), Immigrants from Yemen (15.6%, a difference of 2.3%), and Yakama (15.6%, a difference of 2.3%).
| Demographics | Rating | Rank | Unemployment Among Youth under 25 years |
| West Indians | 0.0 /100 | #319 | Tragic 14.6% |
| Barbadians | 0.0 /100 | #320 | Tragic 14.6% |
| Cheyenne | 0.0 /100 | #321 | Tragic 14.6% |
| Trinidadians and Tobagonians | 0.0 /100 | #322 | Tragic 14.6% |
| Immigrants | Trinidad and Tobago | 0.0 /100 | #323 | Tragic 14.6% |
| Immigrants | Jamaica | 0.0 /100 | #324 | Tragic 14.8% |
| Alaska Natives | 0.0 /100 | #325 | Tragic 14.9% |
| Immigrants | Barbados | 0.0 /100 | #326 | Tragic 15.2% |
| British West Indians | 0.0 /100 | #327 | Tragic 15.5% |
| Immigrants | Dominican Republic | 0.0 /100 | #328 | Tragic 15.6% |
| Immigrants | Yemen | 0.0 /100 | #329 | Tragic 15.6% |
| Yakama | 0.0 /100 | #330 | Tragic 15.6% |
| Dominicans | 0.0 /100 | #331 | Tragic 15.7% |
| Immigrants | Grenada | 0.0 /100 | #332 | Tragic 15.8% |
| Guyanese | 0.0 /100 | #333 | Tragic 15.9% |
Demographics Similar to Immigrants from Costa Rica by Unemployment Among Youth under 25 years
In terms of unemployment among youth under 25 years, the demographic groups most similar to Immigrants from Costa Rica are Immigrants from Peru (11.8%, a difference of 0.010%), Marshallese (11.8%, a difference of 0.050%), Palestinian (11.8%, a difference of 0.060%), Peruvian (11.8%, a difference of 0.10%), and Arab (11.8%, a difference of 0.21%).
| Demographics | Rating | Rank | Unemployment Among Youth under 25 years |
| Koreans | 23.9 /100 | #197 | Fair 11.7% |
| Cherokee | 21.2 /100 | #198 | Fair 11.8% |
| Immigrants | Colombia | 20.9 /100 | #199 | Fair 11.8% |
| Arabs | 18.0 /100 | #200 | Poor 11.8% |
| Palestinians | 16.0 /100 | #201 | Poor 11.8% |
| Marshallese | 15.8 /100 | #202 | Poor 11.8% |
| Immigrants | Peru | 15.3 /100 | #203 | Poor 11.8% |
| Immigrants | Costa Rica | 15.2 /100 | #204 | Poor 11.8% |
| Peruvians | 14.0 /100 | #205 | Poor 11.8% |
| Immigrants | Pakistan | 12.6 /100 | #206 | Poor 11.8% |
| Immigrants | Southern Europe | 12.3 /100 | #207 | Poor 11.8% |
| Comanche | 12.1 /100 | #208 | Poor 11.8% |
| Immigrants | Lebanon | 11.3 /100 | #209 | Poor 11.8% |
| Assyrians/Chaldeans/Syriacs | 9.8 /100 | #210 | Tragic 11.9% |
| Immigrants | Philippines | 9.2 /100 | #211 | Tragic 11.9% |