Immigrants from Bangladesh vs Immigrants from Germany Receiving Food Stamps
COMPARE
Immigrants from Bangladesh
Immigrants from Germany
Receiving Food Stamps
Receiving Food Stamps Comparison
Immigrants from Bangladesh
Immigrants from Germany
15.9%
RECEIVING FOOD STAMPS
0.0/ 100
METRIC RATING
300th/ 347
METRIC RANK
10.7%
RECEIVING FOOD STAMPS
92.0/ 100
METRIC RATING
132nd/ 347
METRIC RANK
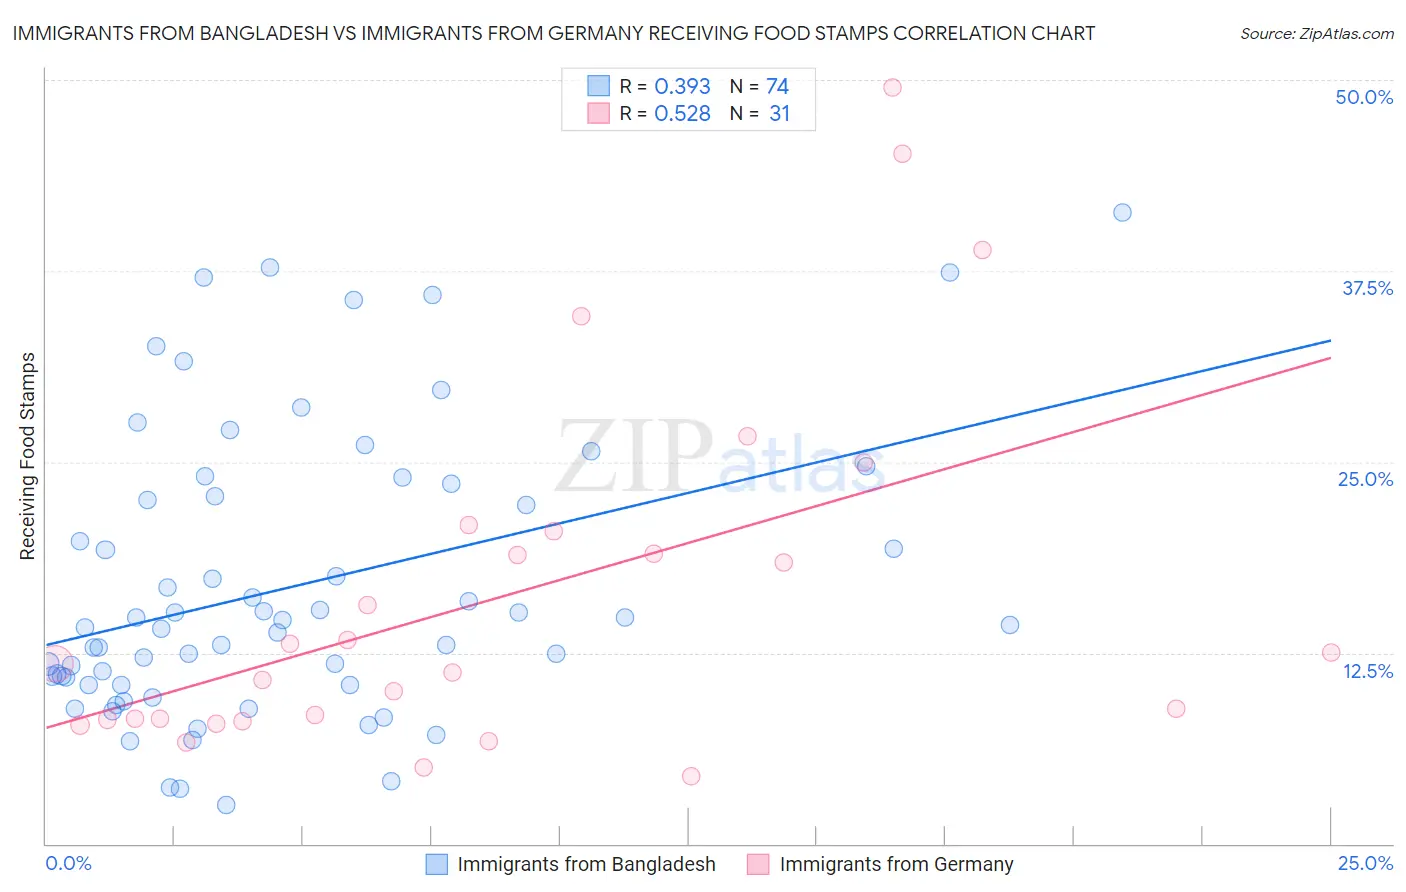
Immigrants from Bangladesh vs Immigrants from Germany Receiving Food Stamps Correlation Chart
The statistical analysis conducted on geographies consisting of 203,302,567 people shows a mild positive correlation between the proportion of Immigrants from Bangladesh and percentage of population receiving government assistance and/or food stamps in the United States with a correlation coefficient (R) of 0.393 and weighted average of 15.9%. Similarly, the statistical analysis conducted on geographies consisting of 462,380,802 people shows a substantial positive correlation between the proportion of Immigrants from Germany and percentage of population receiving government assistance and/or food stamps in the United States with a correlation coefficient (R) of 0.528 and weighted average of 10.7%, a difference of 48.1%.
Receiving Food Stamps Correlation Summary
| Measurement | Immigrants from Bangladesh | Immigrants from Germany |
| Minimum | 2.5% | 4.4% |
| Maximum | 41.3% | 49.5% |
| Range | 38.8% | 45.1% |
| Mean | 16.8% | 16.2% |
| Median | 14.2% | 11.8% |
| Interquartile 25% (IQ1) | 10.4% | 8.1% |
| Interquartile 75% (IQ3) | 22.7% | 20.5% |
| Interquartile Range (IQR) | 12.3% | 12.4% |
| Standard Deviation (Sample) | 9.2% | 11.8% |
| Standard Deviation (Population) | 9.2% | 11.6% |
Similar Demographics by Receiving Food Stamps
Demographics Similar to Immigrants from Bangladesh by Receiving Food Stamps
In terms of receiving food stamps, the demographic groups most similar to Immigrants from Bangladesh are Hispanic or Latino (15.8%, a difference of 0.43%), Trinidadian and Tobagonian (16.0%, a difference of 0.45%), Immigrants from Trinidad and Tobago (15.8%, a difference of 0.71%), Immigrants from Bahamas (15.8%, a difference of 0.96%), and Tsimshian (15.7%, a difference of 1.1%).
| Demographics | Rating | Rank | Receiving Food Stamps |
| Vietnamese | 0.0 /100 | #293 | Tragic 15.7% |
| Immigrants | Latin America | 0.0 /100 | #294 | Tragic 15.7% |
| Immigrants | Honduras | 0.0 /100 | #295 | Tragic 15.7% |
| Tsimshian | 0.0 /100 | #296 | Tragic 15.7% |
| Immigrants | Bahamas | 0.0 /100 | #297 | Tragic 15.8% |
| Immigrants | Trinidad and Tobago | 0.0 /100 | #298 | Tragic 15.8% |
| Hispanics or Latinos | 0.0 /100 | #299 | Tragic 15.8% |
| Immigrants | Bangladesh | 0.0 /100 | #300 | Tragic 15.9% |
| Trinidadians and Tobagonians | 0.0 /100 | #301 | Tragic 16.0% |
| Immigrants | West Indies | 0.0 /100 | #302 | Tragic 16.1% |
| Nicaraguans | 0.0 /100 | #303 | Tragic 16.1% |
| West Indians | 0.0 /100 | #304 | Tragic 16.3% |
| Immigrants | Azores | 0.0 /100 | #305 | Tragic 16.4% |
| Jamaicans | 0.0 /100 | #306 | Tragic 16.4% |
| Houma | 0.0 /100 | #307 | Tragic 16.5% |
Demographics Similar to Immigrants from Germany by Receiving Food Stamps
In terms of receiving food stamps, the demographic groups most similar to Immigrants from Germany are Israeli (10.7%, a difference of 0.20%), French (10.7%, a difference of 0.20%), Immigrants from Jordan (10.7%, a difference of 0.30%), Yugoslavian (10.7%, a difference of 0.30%), and Immigrants from Ethiopia (10.7%, a difference of 0.31%).
| Demographics | Rating | Rank | Receiving Food Stamps |
| Ukrainians | 92.8 /100 | #125 | Exceptional 10.7% |
| Afghans | 92.6 /100 | #126 | Exceptional 10.7% |
| Immigrants | Ethiopia | 92.6 /100 | #127 | Exceptional 10.7% |
| Immigrants | Jordan | 92.5 /100 | #128 | Exceptional 10.7% |
| Yugoslavians | 92.5 /100 | #129 | Exceptional 10.7% |
| Israelis | 92.4 /100 | #130 | Exceptional 10.7% |
| French | 92.3 /100 | #131 | Exceptional 10.7% |
| Immigrants | Germany | 92.0 /100 | #132 | Exceptional 10.7% |
| Immigrants | Russia | 90.9 /100 | #133 | Exceptional 10.8% |
| Immigrants | Brazil | 90.3 /100 | #134 | Exceptional 10.8% |
| Argentineans | 90.2 /100 | #135 | Exceptional 10.8% |
| Slovaks | 89.8 /100 | #136 | Excellent 10.8% |
| Immigrants | Eastern Europe | 89.8 /100 | #137 | Excellent 10.8% |
| Immigrants | Moldova | 88.5 /100 | #138 | Excellent 10.9% |
| Hmong | 88.4 /100 | #139 | Excellent 10.9% |