Immigrants from Bangladesh vs Immigrants from Romania Child Poverty Among Boys Under 16
COMPARE
Immigrants from Bangladesh
Immigrants from Romania
Child Poverty Among Boys Under 16
Child Poverty Among Boys Under 16 Comparison
Immigrants from Bangladesh
Immigrants from Romania
19.9%
CHILD POVERTY AMONG BOYS UNDER 16
0.0/ 100
METRIC RATING
274th/ 347
METRIC RANK
14.5%
CHILD POVERTY AMONG BOYS UNDER 16
98.5/ 100
METRIC RATING
64th/ 347
METRIC RANK
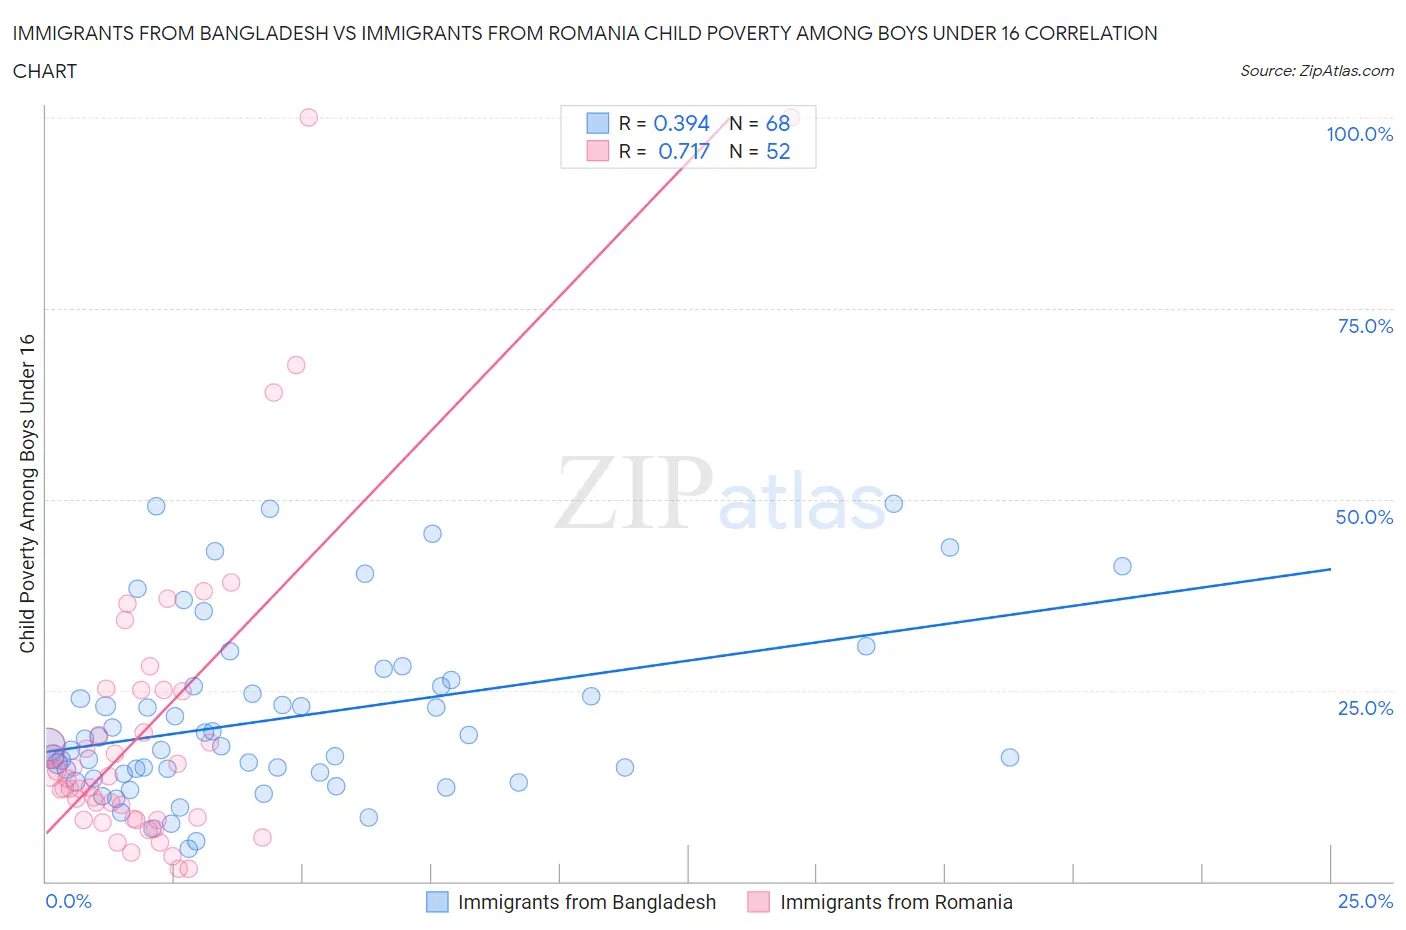
Immigrants from Bangladesh vs Immigrants from Romania Child Poverty Among Boys Under 16 Correlation Chart
The statistical analysis conducted on geographies consisting of 202,330,281 people shows a mild positive correlation between the proportion of Immigrants from Bangladesh and poverty level among boys under the age of 16 in the United States with a correlation coefficient (R) of 0.394 and weighted average of 19.9%. Similarly, the statistical analysis conducted on geographies consisting of 253,981,907 people shows a strong positive correlation between the proportion of Immigrants from Romania and poverty level among boys under the age of 16 in the United States with a correlation coefficient (R) of 0.717 and weighted average of 14.5%, a difference of 37.2%.
Child Poverty Among Boys Under 16 Correlation Summary
| Measurement | Immigrants from Bangladesh | Immigrants from Romania |
| Minimum | 4.2% | 1.6% |
| Maximum | 49.5% | 100.0% |
| Range | 45.3% | 98.4% |
| Mean | 21.3% | 20.3% |
| Median | 17.8% | 13.6% |
| Interquartile 25% (IQ1) | 14.1% | 8.1% |
| Interquartile 75% (IQ3) | 25.6% | 24.9% |
| Interquartile Range (IQR) | 11.4% | 16.8% |
| Standard Deviation (Sample) | 11.3% | 21.1% |
| Standard Deviation (Population) | 11.2% | 20.9% |
Similar Demographics by Child Poverty Among Boys Under 16
Demographics Similar to Immigrants from Bangladesh by Child Poverty Among Boys Under 16
In terms of child poverty among boys under 16, the demographic groups most similar to Immigrants from Bangladesh are Jamaican (20.0%, a difference of 0.12%), Belizean (19.9%, a difference of 0.25%), Subsaharan African (20.0%, a difference of 0.29%), Immigrants from Ecuador (19.8%, a difference of 0.39%), and Immigrants from Barbados (20.0%, a difference of 0.39%).
| Demographics | Rating | Rank | Child Poverty Among Boys Under 16 |
| Vietnamese | 0.1 /100 | #267 | Tragic 19.6% |
| Spanish American Indians | 0.1 /100 | #268 | Tragic 19.6% |
| Immigrants | Cabo Verde | 0.1 /100 | #269 | Tragic 19.7% |
| Cherokee | 0.1 /100 | #270 | Tragic 19.7% |
| Chickasaw | 0.1 /100 | #271 | Tragic 19.8% |
| Immigrants | Ecuador | 0.1 /100 | #272 | Tragic 19.8% |
| Belizeans | 0.1 /100 | #273 | Tragic 19.9% |
| Immigrants | Bangladesh | 0.0 /100 | #274 | Tragic 19.9% |
| Jamaicans | 0.0 /100 | #275 | Tragic 20.0% |
| Sub-Saharan Africans | 0.0 /100 | #276 | Tragic 20.0% |
| Immigrants | Barbados | 0.0 /100 | #277 | Tragic 20.0% |
| Immigrants | West Indies | 0.0 /100 | #278 | Tragic 20.0% |
| Bangladeshis | 0.0 /100 | #279 | Tragic 20.0% |
| Central Americans | 0.0 /100 | #280 | Tragic 20.1% |
| Immigrants | Zaire | 0.0 /100 | #281 | Tragic 20.1% |
Demographics Similar to Immigrants from Romania by Child Poverty Among Boys Under 16
In terms of child poverty among boys under 16, the demographic groups most similar to Immigrants from Romania are Soviet Union (14.5%, a difference of 0.030%), Immigrants from Bulgaria (14.5%, a difference of 0.030%), Immigrants from Europe (14.5%, a difference of 0.060%), Cambodian (14.5%, a difference of 0.13%), and Slovene (14.5%, a difference of 0.15%).
| Demographics | Rating | Rank | Child Poverty Among Boys Under 16 |
| Poles | 98.9 /100 | #57 | Exceptional 14.4% |
| Immigrants | Sweden | 98.9 /100 | #58 | Exceptional 14.4% |
| Immigrants | Czechoslovakia | 98.9 /100 | #59 | Exceptional 14.4% |
| Immigrants | Belgium | 98.9 /100 | #60 | Exceptional 14.4% |
| Scandinavians | 98.8 /100 | #61 | Exceptional 14.4% |
| Immigrants | Israel | 98.7 /100 | #62 | Exceptional 14.4% |
| Cambodians | 98.5 /100 | #63 | Exceptional 14.5% |
| Immigrants | Romania | 98.5 /100 | #64 | Exceptional 14.5% |
| Soviet Union | 98.5 /100 | #65 | Exceptional 14.5% |
| Immigrants | Bulgaria | 98.5 /100 | #66 | Exceptional 14.5% |
| Immigrants | Europe | 98.4 /100 | #67 | Exceptional 14.5% |
| Slovenes | 98.4 /100 | #68 | Exceptional 14.5% |
| Immigrants | Austria | 98.4 /100 | #69 | Exceptional 14.5% |
| Europeans | 98.4 /100 | #70 | Exceptional 14.5% |
| Immigrants | Netherlands | 98.1 /100 | #71 | Exceptional 14.6% |