Immigrants from Argentina vs Immigrants from Western Europe Female Poverty Among 25-34 Year Olds
COMPARE
Immigrants from Argentina
Immigrants from Western Europe
Female Poverty Among 25-34 Year Olds
Female Poverty Among 25-34 Year Olds Comparison
Immigrants from Argentina
Immigrants from Western Europe
12.6%
FEMALE POVERTY AMONG 25-34 YEAR OLDS
96.4/ 100
METRIC RATING
99th/ 347
METRIC RANK
13.3%
FEMALE POVERTY AMONG 25-34 YEAR OLDS
70.3/ 100
METRIC RATING
157th/ 347
METRIC RANK
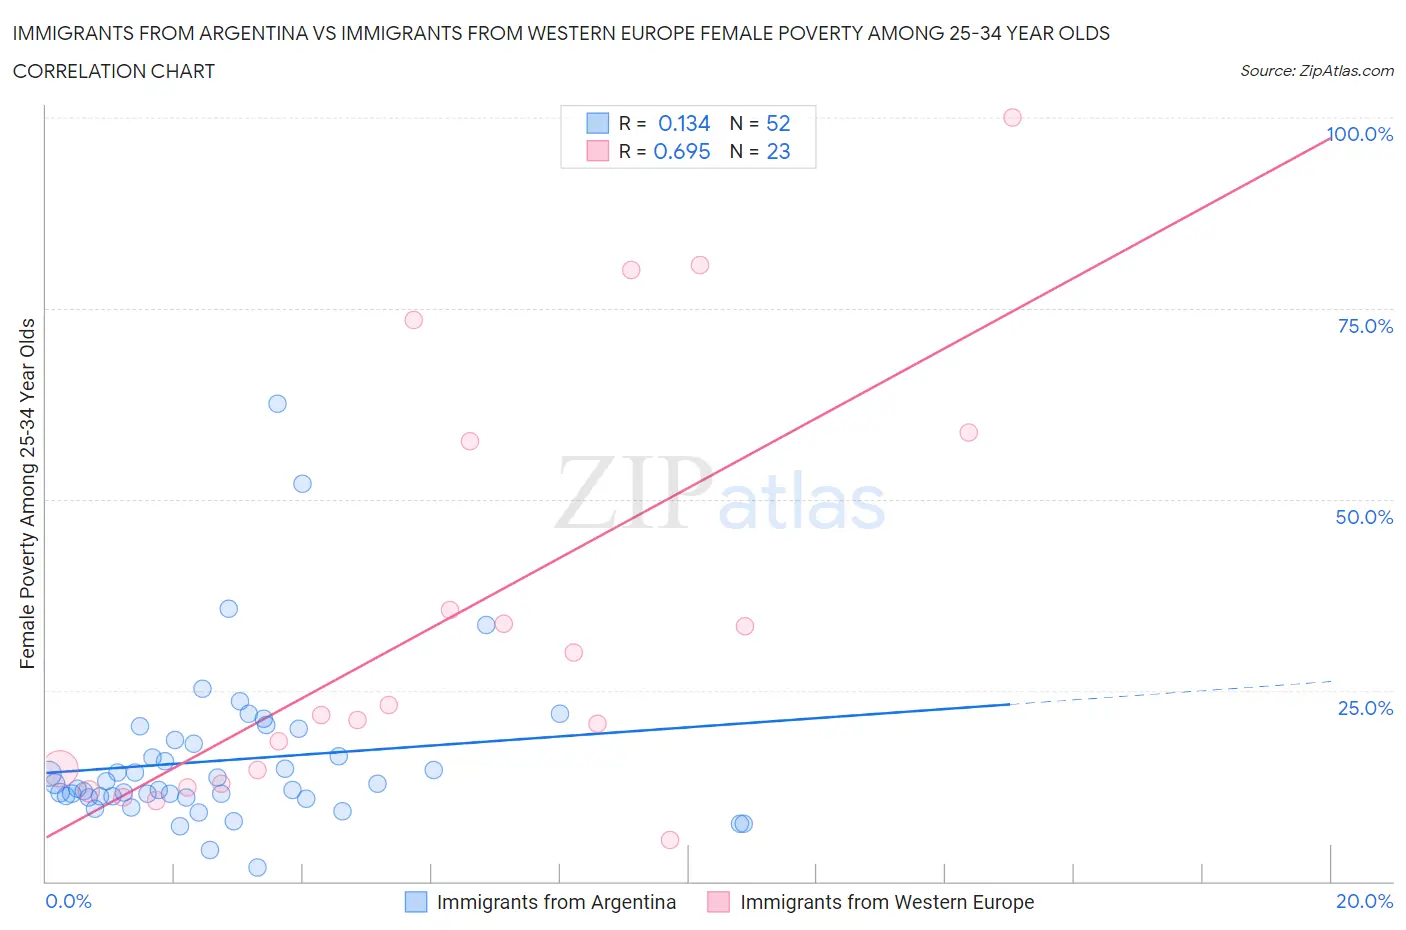
Immigrants from Argentina vs Immigrants from Western Europe Female Poverty Among 25-34 Year Olds Correlation Chart
The statistical analysis conducted on geographies consisting of 261,759,326 people shows a poor positive correlation between the proportion of Immigrants from Argentina and poverty level among females between the ages 25 and 34 in the United States with a correlation coefficient (R) of 0.134 and weighted average of 12.6%. Similarly, the statistical analysis conducted on geographies consisting of 481,489,982 people shows a significant positive correlation between the proportion of Immigrants from Western Europe and poverty level among females between the ages 25 and 34 in the United States with a correlation coefficient (R) of 0.695 and weighted average of 13.3%, a difference of 5.4%.
Female Poverty Among 25-34 Year Olds Correlation Summary
| Measurement | Immigrants from Argentina | Immigrants from Western Europe |
| Minimum | 1.8% | 5.4% |
| Maximum | 62.5% | 100.0% |
| Range | 60.7% | 94.6% |
| Mean | 15.8% | 34.0% |
| Median | 12.5% | 21.8% |
| Interquartile 25% (IQ1) | 11.0% | 12.8% |
| Interquartile 75% (IQ3) | 18.2% | 57.6% |
| Interquartile Range (IQR) | 7.2% | 44.7% |
| Standard Deviation (Sample) | 10.5% | 27.2% |
| Standard Deviation (Population) | 10.4% | 26.6% |
Similar Demographics by Female Poverty Among 25-34 Year Olds
Demographics Similar to Immigrants from Argentina by Female Poverty Among 25-34 Year Olds
In terms of female poverty among 25-34 year olds, the demographic groups most similar to Immigrants from Argentina are Immigrants from Northern Africa (12.6%, a difference of 0.11%), Immigrants from Ethiopia (12.6%, a difference of 0.11%), Immigrants from Zimbabwe (12.6%, a difference of 0.23%), Ukrainian (12.6%, a difference of 0.24%), and Immigrants from France (12.6%, a difference of 0.28%).
| Demographics | Rating | Rank | Female Poverty Among 25-34 Year Olds |
| Immigrants | Armenia | 96.9 /100 | #92 | Exceptional 12.6% |
| Palestinians | 96.9 /100 | #93 | Exceptional 12.6% |
| Immigrants | France | 96.8 /100 | #94 | Exceptional 12.6% |
| Ukrainians | 96.7 /100 | #95 | Exceptional 12.6% |
| Immigrants | Zimbabwe | 96.7 /100 | #96 | Exceptional 12.6% |
| Immigrants | Northern Africa | 96.6 /100 | #97 | Exceptional 12.6% |
| Immigrants | Ethiopia | 96.5 /100 | #98 | Exceptional 12.6% |
| Immigrants | Argentina | 96.4 /100 | #99 | Exceptional 12.6% |
| Immigrants | Denmark | 95.7 /100 | #100 | Exceptional 12.7% |
| Immigrants | Switzerland | 95.7 /100 | #101 | Exceptional 12.7% |
| Peruvians | 95.6 /100 | #102 | Exceptional 12.7% |
| Immigrants | Spain | 95.5 /100 | #103 | Exceptional 12.7% |
| Swedes | 95.4 /100 | #104 | Exceptional 12.7% |
| Immigrants | South Africa | 95.3 /100 | #105 | Exceptional 12.7% |
| Tsimshian | 95.1 /100 | #106 | Exceptional 12.7% |
Demographics Similar to Immigrants from Western Europe by Female Poverty Among 25-34 Year Olds
In terms of female poverty among 25-34 year olds, the demographic groups most similar to Immigrants from Western Europe are Immigrants from Colombia (13.3%, a difference of 0.11%), Immigrants from Cameroon (13.3%, a difference of 0.17%), Immigrants from Sierra Leone (13.3%, a difference of 0.27%), Arab (13.2%, a difference of 0.33%), and Uruguayan (13.3%, a difference of 0.33%).
| Demographics | Rating | Rank | Female Poverty Among 25-34 Year Olds |
| Iraqis | 76.0 /100 | #150 | Good 13.2% |
| Costa Ricans | 75.8 /100 | #151 | Good 13.2% |
| Slavs | 75.7 /100 | #152 | Good 13.2% |
| Northern Europeans | 73.7 /100 | #153 | Good 13.2% |
| Arabs | 73.5 /100 | #154 | Good 13.2% |
| Immigrants | Sierra Leone | 72.9 /100 | #155 | Good 13.3% |
| Immigrants | Cameroon | 72.0 /100 | #156 | Good 13.3% |
| Immigrants | Western Europe | 70.3 /100 | #157 | Good 13.3% |
| Immigrants | Colombia | 69.2 /100 | #158 | Good 13.3% |
| Uruguayans | 66.9 /100 | #159 | Good 13.3% |
| Immigrants | South America | 66.3 /100 | #160 | Good 13.3% |
| Icelanders | 65.7 /100 | #161 | Good 13.3% |
| Ugandans | 64.1 /100 | #162 | Good 13.4% |
| British | 63.5 /100 | #163 | Good 13.4% |
| Swiss | 61.7 /100 | #164 | Good 13.4% |