Immigrants from Austria vs Immigrants from South Africa Female Poverty Among 25-34 Year Olds
COMPARE
Immigrants from Austria
Immigrants from South Africa
Female Poverty Among 25-34 Year Olds
Female Poverty Among 25-34 Year Olds Comparison
Immigrants from Austria
Immigrants from South Africa
12.5%
FEMALE POVERTY AMONG 25-34 YEAR OLDS
97.4/ 100
METRIC RATING
88th/ 347
METRIC RANK
12.7%
FEMALE POVERTY AMONG 25-34 YEAR OLDS
95.3/ 100
METRIC RATING
105th/ 347
METRIC RANK
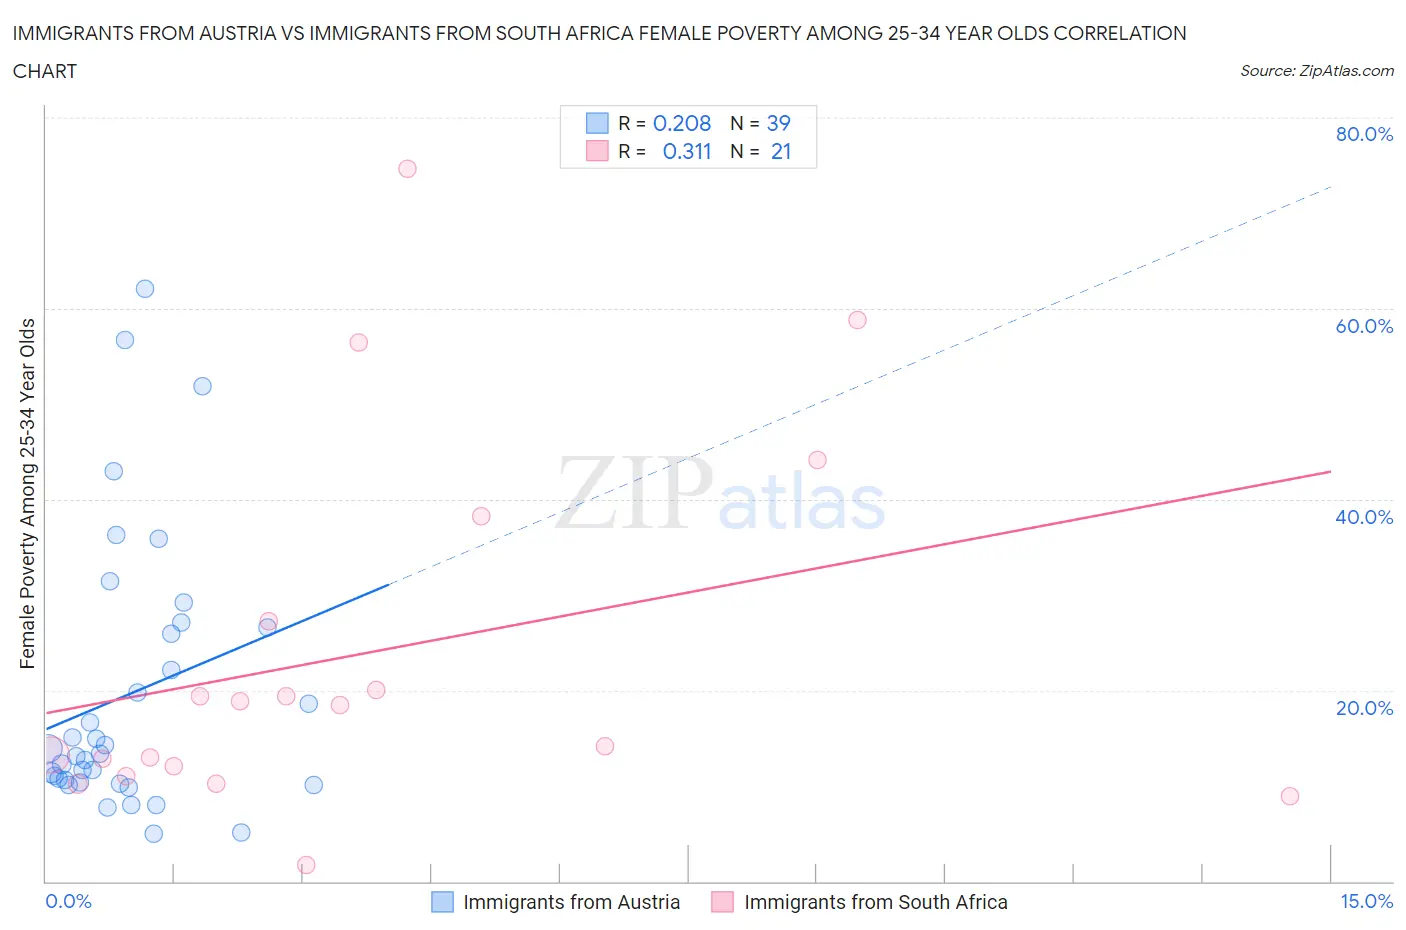
Immigrants from Austria vs Immigrants from South Africa Female Poverty Among 25-34 Year Olds Correlation Chart
The statistical analysis conducted on geographies consisting of 166,374,239 people shows a weak positive correlation between the proportion of Immigrants from Austria and poverty level among females between the ages 25 and 34 in the United States with a correlation coefficient (R) of 0.208 and weighted average of 12.5%. Similarly, the statistical analysis conducted on geographies consisting of 230,050,915 people shows a mild positive correlation between the proportion of Immigrants from South Africa and poverty level among females between the ages 25 and 34 in the United States with a correlation coefficient (R) of 0.311 and weighted average of 12.7%, a difference of 1.4%.
Female Poverty Among 25-34 Year Olds Correlation Summary
| Measurement | Immigrants from Austria | Immigrants from South Africa |
| Minimum | 5.0% | 1.8% |
| Maximum | 62.1% | 74.6% |
| Range | 57.0% | 72.8% |
| Mean | 19.6% | 23.9% |
| Median | 13.3% | 18.5% |
| Interquartile 25% (IQ1) | 10.3% | 11.6% |
| Interquartile 75% (IQ3) | 26.5% | 32.7% |
| Interquartile Range (IQR) | 16.2% | 21.1% |
| Standard Deviation (Sample) | 14.2% | 19.3% |
| Standard Deviation (Population) | 14.1% | 18.8% |
Demographics Similar to Immigrants from Austria and Immigrants from South Africa by Female Poverty Among 25-34 Year Olds
In terms of female poverty among 25-34 year olds, the demographic groups most similar to Immigrants from Austria are Argentinean (12.5%, a difference of 0.070%), Croatian (12.5%, a difference of 0.10%), Italian (12.5%, a difference of 0.17%), Immigrants from Albania (12.5%, a difference of 0.32%), and Norwegian (12.6%, a difference of 0.42%). Similarly, the demographic groups most similar to Immigrants from South Africa are Swedish (12.7%, a difference of 0.050%), Immigrants from Spain (12.7%, a difference of 0.090%), Tsimshian (12.7%, a difference of 0.10%), Peruvian (12.7%, a difference of 0.16%), and Immigrants from Switzerland (12.7%, a difference of 0.22%).
| Demographics | Rating | Rank | Female Poverty Among 25-34 Year Olds |
| Croatians | 97.5 /100 | #86 | Exceptional 12.5% |
| Argentineans | 97.5 /100 | #87 | Exceptional 12.5% |
| Immigrants | Austria | 97.4 /100 | #88 | Exceptional 12.5% |
| Italians | 97.2 /100 | #89 | Exceptional 12.5% |
| Immigrants | Albania | 97.1 /100 | #90 | Exceptional 12.5% |
| Norwegians | 96.9 /100 | #91 | Exceptional 12.6% |
| Immigrants | Armenia | 96.9 /100 | #92 | Exceptional 12.6% |
| Palestinians | 96.9 /100 | #93 | Exceptional 12.6% |
| Immigrants | France | 96.8 /100 | #94 | Exceptional 12.6% |
| Ukrainians | 96.7 /100 | #95 | Exceptional 12.6% |
| Immigrants | Zimbabwe | 96.7 /100 | #96 | Exceptional 12.6% |
| Immigrants | Northern Africa | 96.6 /100 | #97 | Exceptional 12.6% |
| Immigrants | Ethiopia | 96.5 /100 | #98 | Exceptional 12.6% |
| Immigrants | Argentina | 96.4 /100 | #99 | Exceptional 12.6% |
| Immigrants | Denmark | 95.7 /100 | #100 | Exceptional 12.7% |
| Immigrants | Switzerland | 95.7 /100 | #101 | Exceptional 12.7% |
| Peruvians | 95.6 /100 | #102 | Exceptional 12.7% |
| Immigrants | Spain | 95.5 /100 | #103 | Exceptional 12.7% |
| Swedes | 95.4 /100 | #104 | Exceptional 12.7% |
| Immigrants | South Africa | 95.3 /100 | #105 | Exceptional 12.7% |
| Tsimshian | 95.1 /100 | #106 | Exceptional 12.7% |