Immigrants from Austria vs Immigrants from South Africa In Labor Force | Age 16-19
COMPARE
Immigrants from Austria
Immigrants from South Africa
In Labor Force | Age 16-19
In Labor Force | Age 16-19 Comparison
Immigrants from Austria
Immigrants from South Africa
37.9%
IN LABOR FORCE | AGE 16-19
95.0/ 100
METRIC RATING
131st/ 347
METRIC RANK
36.8%
IN LABOR FORCE | AGE 16-19
60.5/ 100
METRIC RATING
170th/ 347
METRIC RANK
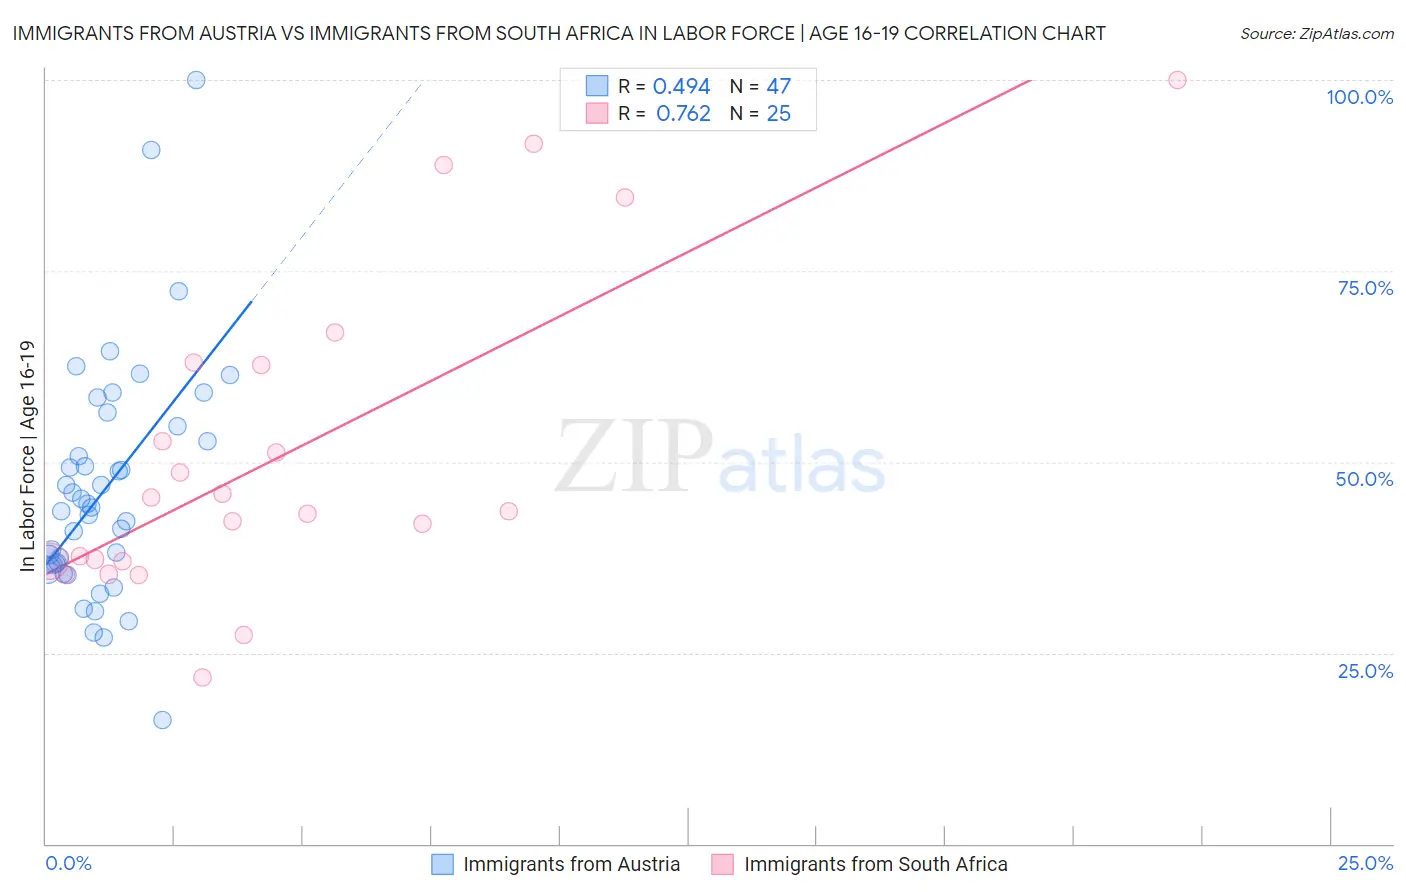
Immigrants from Austria vs Immigrants from South Africa In Labor Force | Age 16-19 Correlation Chart
The statistical analysis conducted on geographies consisting of 167,731,436 people shows a moderate positive correlation between the proportion of Immigrants from Austria and labor force participation rate among population between the ages 16 and 19 in the United States with a correlation coefficient (R) of 0.494 and weighted average of 37.9%. Similarly, the statistical analysis conducted on geographies consisting of 232,958,453 people shows a strong positive correlation between the proportion of Immigrants from South Africa and labor force participation rate among population between the ages 16 and 19 in the United States with a correlation coefficient (R) of 0.762 and weighted average of 36.8%, a difference of 3.2%.
In Labor Force | Age 16-19 Correlation Summary
| Measurement | Immigrants from Austria | Immigrants from South Africa |
| Minimum | 16.2% | 21.8% |
| Maximum | 100.0% | 100.0% |
| Range | 83.8% | 78.2% |
| Mean | 46.4% | 51.0% |
| Median | 44.0% | 43.5% |
| Interquartile 25% (IQ1) | 36.6% | 37.0% |
| Interquartile 75% (IQ3) | 54.7% | 62.9% |
| Interquartile Range (IQR) | 18.1% | 25.9% |
| Standard Deviation (Sample) | 15.5% | 20.8% |
| Standard Deviation (Population) | 15.4% | 20.4% |
Similar Demographics by In Labor Force | Age 16-19
Demographics Similar to Immigrants from Austria by In Labor Force | Age 16-19
In terms of in labor force | age 16-19, the demographic groups most similar to Immigrants from Austria are Immigrants from Oceania (37.9%, a difference of 0.080%), Immigrants from Zimbabwe (38.0%, a difference of 0.090%), Cheyenne (37.9%, a difference of 0.11%), Spaniard (38.0%, a difference of 0.12%), and Choctaw (38.0%, a difference of 0.15%).
| Demographics | Rating | Rank | In Labor Force | Age 16-19 |
| Immigrants | England | 96.4 /100 | #124 | Exceptional 38.1% |
| Immigrants | Africa | 96.1 /100 | #125 | Exceptional 38.0% |
| Africans | 95.6 /100 | #126 | Exceptional 38.0% |
| Choctaw | 95.6 /100 | #127 | Exceptional 38.0% |
| New Zealanders | 95.6 /100 | #128 | Exceptional 38.0% |
| Spaniards | 95.5 /100 | #129 | Exceptional 38.0% |
| Immigrants | Zimbabwe | 95.4 /100 | #130 | Exceptional 38.0% |
| Immigrants | Austria | 95.0 /100 | #131 | Exceptional 37.9% |
| Immigrants | Oceania | 94.7 /100 | #132 | Exceptional 37.9% |
| Cheyenne | 94.6 /100 | #133 | Exceptional 37.9% |
| Immigrants | Netherlands | 93.7 /100 | #134 | Exceptional 37.8% |
| Macedonians | 93.4 /100 | #135 | Exceptional 37.8% |
| Australians | 93.2 /100 | #136 | Exceptional 37.8% |
| Cajuns | 93.2 /100 | #137 | Exceptional 37.8% |
| Comanche | 91.9 /100 | #138 | Exceptional 37.7% |
Demographics Similar to Immigrants from South Africa by In Labor Force | Age 16-19
In terms of in labor force | age 16-19, the demographic groups most similar to Immigrants from South Africa are Immigrants from Latvia (36.8%, a difference of 0.060%), Immigrants from Cambodia (36.7%, a difference of 0.11%), South African (36.7%, a difference of 0.11%), Palestinian (36.8%, a difference of 0.14%), and Russian (36.7%, a difference of 0.15%).
| Demographics | Rating | Rank | In Labor Force | Age 16-19 |
| Bermudans | 69.3 /100 | #163 | Good 36.9% |
| Immigrants | Kuwait | 68.9 /100 | #164 | Good 36.9% |
| Yakama | 66.9 /100 | #165 | Good 36.9% |
| Immigrants | Western Africa | 66.7 /100 | #166 | Good 36.9% |
| Arabs | 63.6 /100 | #167 | Good 36.8% |
| Palestinians | 63.1 /100 | #168 | Good 36.8% |
| Immigrants | Latvia | 61.6 /100 | #169 | Good 36.8% |
| Immigrants | South Africa | 60.5 /100 | #170 | Good 36.8% |
| Immigrants | Cambodia | 58.4 /100 | #171 | Average 36.7% |
| South Africans | 58.3 /100 | #172 | Average 36.7% |
| Russians | 57.5 /100 | #173 | Average 36.7% |
| Immigrants | Czechoslovakia | 50.0 /100 | #174 | Average 36.6% |
| Natives/Alaskans | 49.0 /100 | #175 | Average 36.6% |
| Albanians | 48.8 /100 | #176 | Average 36.5% |
| Immigrants | Northern Europe | 46.6 /100 | #177 | Average 36.5% |