Immigrants from Austria vs Immigrants from South Africa 4th Grade
COMPARE
Immigrants from Austria
Immigrants from South Africa
4th Grade
4th Grade Comparison
Immigrants from Austria
Immigrants from South Africa
98.0%
4TH GRADE
99.6/ 100
METRIC RATING
70th/ 347
METRIC RANK
97.9%
4TH GRADE
98.8/ 100
METRIC RATING
88th/ 347
METRIC RANK
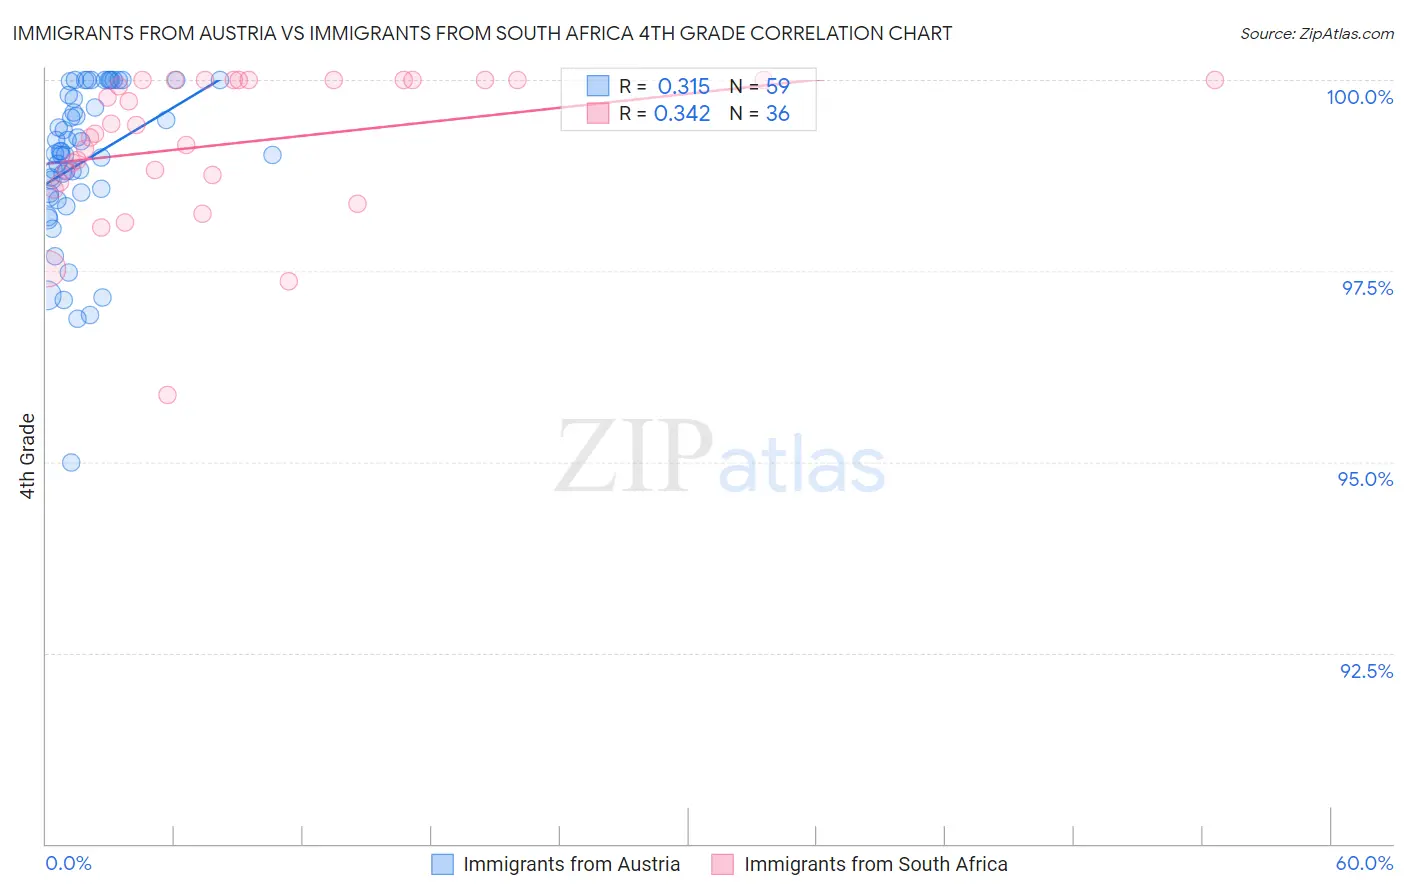
Immigrants from Austria vs Immigrants from South Africa 4th Grade Correlation Chart
The statistical analysis conducted on geographies consisting of 167,973,800 people shows a mild positive correlation between the proportion of Immigrants from Austria and percentage of population with at least 4th grade education in the United States with a correlation coefficient (R) of 0.315 and weighted average of 98.0%. Similarly, the statistical analysis conducted on geographies consisting of 233,321,693 people shows a mild positive correlation between the proportion of Immigrants from South Africa and percentage of population with at least 4th grade education in the United States with a correlation coefficient (R) of 0.342 and weighted average of 97.9%, a difference of 0.10%.
4th Grade Correlation Summary
| Measurement | Immigrants from Austria | Immigrants from South Africa |
| Minimum | 95.0% | 95.9% |
| Maximum | 100.0% | 100.0% |
| Range | 5.0% | 4.1% |
| Mean | 98.9% | 99.2% |
| Median | 99.0% | 99.4% |
| Interquartile 25% (IQ1) | 98.5% | 98.7% |
| Interquartile 75% (IQ3) | 99.8% | 100.0% |
| Interquartile Range (IQR) | 1.3% | 1.3% |
| Standard Deviation (Sample) | 1.0% | 0.96% |
| Standard Deviation (Population) | 1.0% | 0.94% |
Demographics Similar to Immigrants from Austria and Immigrants from South Africa by 4th Grade
In terms of 4th grade, the demographic groups most similar to Immigrants from Austria are Pueblo (98.0%, a difference of 0.0%), Lumbee (98.0%, a difference of 0.0%), Iranian (98.0%, a difference of 0.030%), Macedonian (98.0%, a difference of 0.030%), and Chickasaw (98.0%, a difference of 0.030%). Similarly, the demographic groups most similar to Immigrants from South Africa are Immigrants from Australia (97.9%, a difference of 0.0%), Zimbabwean (97.9%, a difference of 0.0%), Delaware (97.9%, a difference of 0.0%), Cypriot (97.9%, a difference of 0.010%), and Potawatomi (97.9%, a difference of 0.010%).
| Demographics | Rating | Rank | 4th Grade |
| Pueblo | 99.6 /100 | #69 | Exceptional 98.0% |
| Immigrants | Austria | 99.6 /100 | #70 | Exceptional 98.0% |
| Lumbee | 99.6 /100 | #71 | Exceptional 98.0% |
| Iranians | 99.4 /100 | #72 | Exceptional 98.0% |
| Macedonians | 99.4 /100 | #73 | Exceptional 98.0% |
| Chickasaw | 99.4 /100 | #74 | Exceptional 98.0% |
| Immigrants | Netherlands | 99.3 /100 | #75 | Exceptional 98.0% |
| Cherokee | 99.3 /100 | #76 | Exceptional 98.0% |
| Immigrants | Lithuania | 99.3 /100 | #77 | Exceptional 98.0% |
| Immigrants | England | 99.3 /100 | #78 | Exceptional 98.0% |
| Ukrainians | 99.2 /100 | #79 | Exceptional 98.0% |
| Osage | 99.2 /100 | #80 | Exceptional 98.0% |
| Immigrants | India | 99.1 /100 | #81 | Exceptional 98.0% |
| Icelanders | 99.1 /100 | #82 | Exceptional 98.0% |
| Immigrants | Belgium | 99.0 /100 | #83 | Exceptional 97.9% |
| Cypriots | 98.9 /100 | #84 | Exceptional 97.9% |
| Potawatomi | 98.9 /100 | #85 | Exceptional 97.9% |
| Immigrants | Australia | 98.8 /100 | #86 | Exceptional 97.9% |
| Zimbabweans | 98.8 /100 | #87 | Exceptional 97.9% |
| Immigrants | South Africa | 98.8 /100 | #88 | Exceptional 97.9% |
| Delaware | 98.8 /100 | #89 | Exceptional 97.9% |