Immigrants from Austria vs Icelander Female Poverty Among 18-24 Year Olds
COMPARE
Immigrants from Austria
Icelander
Female Poverty Among 18-24 Year Olds
Female Poverty Among 18-24 Year Olds Comparison
Immigrants from Austria
Icelanders
19.7%
FEMALE POVERTY AMONG 18-24 YEAR OLDS
83.1/ 100
METRIC RATING
147th/ 347
METRIC RANK
21.5%
FEMALE POVERTY AMONG 18-24 YEAR OLDS
0.3/ 100
METRIC RATING
263rd/ 347
METRIC RANK
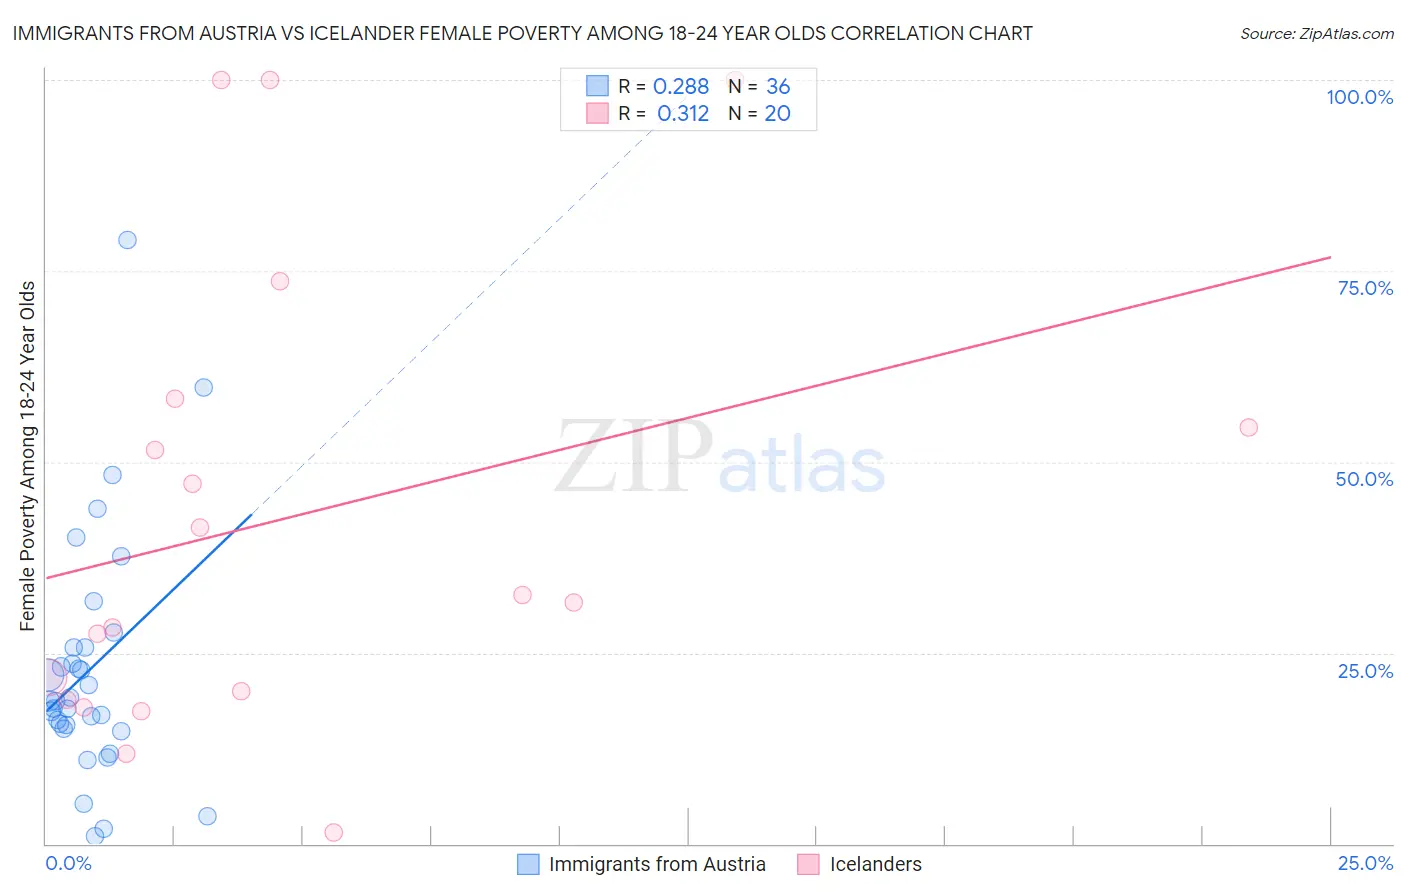
Immigrants from Austria vs Icelander Female Poverty Among 18-24 Year Olds Correlation Chart
The statistical analysis conducted on geographies consisting of 165,272,500 people shows a weak positive correlation between the proportion of Immigrants from Austria and poverty level among females between the ages 18 and 24 in the United States with a correlation coefficient (R) of 0.288 and weighted average of 19.7%. Similarly, the statistical analysis conducted on geographies consisting of 157,989,488 people shows a mild positive correlation between the proportion of Icelanders and poverty level among females between the ages 18 and 24 in the United States with a correlation coefficient (R) of 0.312 and weighted average of 21.5%, a difference of 9.1%.
Female Poverty Among 18-24 Year Olds Correlation Summary
| Measurement | Immigrants from Austria | Icelander |
| Minimum | 1.0% | 1.5% |
| Maximum | 79.1% | 100.0% |
| Range | 78.0% | 98.5% |
| Mean | 22.8% | 42.8% |
| Median | 18.7% | 32.1% |
| Interquartile 25% (IQ1) | 15.3% | 19.4% |
| Interquartile 75% (IQ3) | 25.7% | 56.4% |
| Interquartile Range (IQR) | 10.4% | 37.0% |
| Standard Deviation (Sample) | 15.8% | 30.3% |
| Standard Deviation (Population) | 15.6% | 29.5% |
Similar Demographics by Female Poverty Among 18-24 Year Olds
Demographics Similar to Immigrants from Austria by Female Poverty Among 18-24 Year Olds
In terms of female poverty among 18-24 year olds, the demographic groups most similar to Immigrants from Austria are Immigrants from Bosnia and Herzegovina (19.7%, a difference of 0.050%), Canadian (19.7%, a difference of 0.060%), Immigrants from Northern Africa (19.7%, a difference of 0.090%), Slavic (19.7%, a difference of 0.12%), and Panamanian (19.7%, a difference of 0.13%).
| Demographics | Rating | Rank | Female Poverty Among 18-24 Year Olds |
| Immigrants | Trinidad and Tobago | 85.6 /100 | #140 | Excellent 19.7% |
| Pennsylvania Germans | 85.5 /100 | #141 | Excellent 19.7% |
| Panamanians | 84.6 /100 | #142 | Excellent 19.7% |
| Slavs | 84.4 /100 | #143 | Excellent 19.7% |
| Immigrants | Northern Africa | 84.1 /100 | #144 | Excellent 19.7% |
| Canadians | 83.8 /100 | #145 | Excellent 19.7% |
| Immigrants | Bosnia and Herzegovina | 83.6 /100 | #146 | Excellent 19.7% |
| Immigrants | Austria | 83.1 /100 | #147 | Excellent 19.7% |
| Immigrants | Latin America | 81.3 /100 | #148 | Excellent 19.7% |
| Immigrants | Oceania | 81.2 /100 | #149 | Excellent 19.7% |
| Syrians | 80.2 /100 | #150 | Excellent 19.8% |
| Immigrants | Eastern Asia | 79.7 /100 | #151 | Good 19.8% |
| Yugoslavians | 79.0 /100 | #152 | Good 19.8% |
| Immigrants | Japan | 78.1 /100 | #153 | Good 19.8% |
| Immigrants | Zimbabwe | 76.7 /100 | #154 | Good 19.8% |
Demographics Similar to Icelanders by Female Poverty Among 18-24 Year Olds
In terms of female poverty among 18-24 year olds, the demographic groups most similar to Icelanders are Honduran (21.5%, a difference of 0.050%), Nonimmigrants (21.5%, a difference of 0.060%), Alaska Native (21.5%, a difference of 0.13%), American (21.6%, a difference of 0.21%), and Immigrants from Eastern Africa (21.4%, a difference of 0.35%).
| Demographics | Rating | Rank | Female Poverty Among 18-24 Year Olds |
| Tsimshian | 1.0 /100 | #256 | Tragic 21.2% |
| Taiwanese | 1.0 /100 | #257 | Tragic 21.2% |
| Vietnamese | 0.6 /100 | #258 | Tragic 21.4% |
| Immigrants | France | 0.6 /100 | #259 | Tragic 21.4% |
| Immigrants | Norway | 0.6 /100 | #260 | Tragic 21.4% |
| Immigrants | Bahamas | 0.5 /100 | #261 | Tragic 21.4% |
| Immigrants | Eastern Africa | 0.4 /100 | #262 | Tragic 21.4% |
| Icelanders | 0.3 /100 | #263 | Tragic 21.5% |
| Hondurans | 0.3 /100 | #264 | Tragic 21.5% |
| Immigrants | Nonimmigrants | 0.3 /100 | #265 | Tragic 21.5% |
| Alaska Natives | 0.3 /100 | #266 | Tragic 21.5% |
| Americans | 0.3 /100 | #267 | Tragic 21.6% |
| Immigrants | Burma/Myanmar | 0.2 /100 | #268 | Tragic 21.6% |
| Celtics | 0.2 /100 | #269 | Tragic 21.6% |
| Mongolians | 0.2 /100 | #270 | Tragic 21.6% |