Immigrants from Austria vs Immigrants from Indonesia Per Capita Income
COMPARE
Immigrants from Austria
Immigrants from Indonesia
Per Capita Income
Per Capita Income Comparison
Immigrants from Austria
Immigrants from Indonesia
$52,503
PER CAPITA INCOME
100.0/ 100
METRIC RATING
30th/ 347
METRIC RANK
$48,195
PER CAPITA INCOME
99.4/ 100
METRIC RATING
82nd/ 347
METRIC RANK
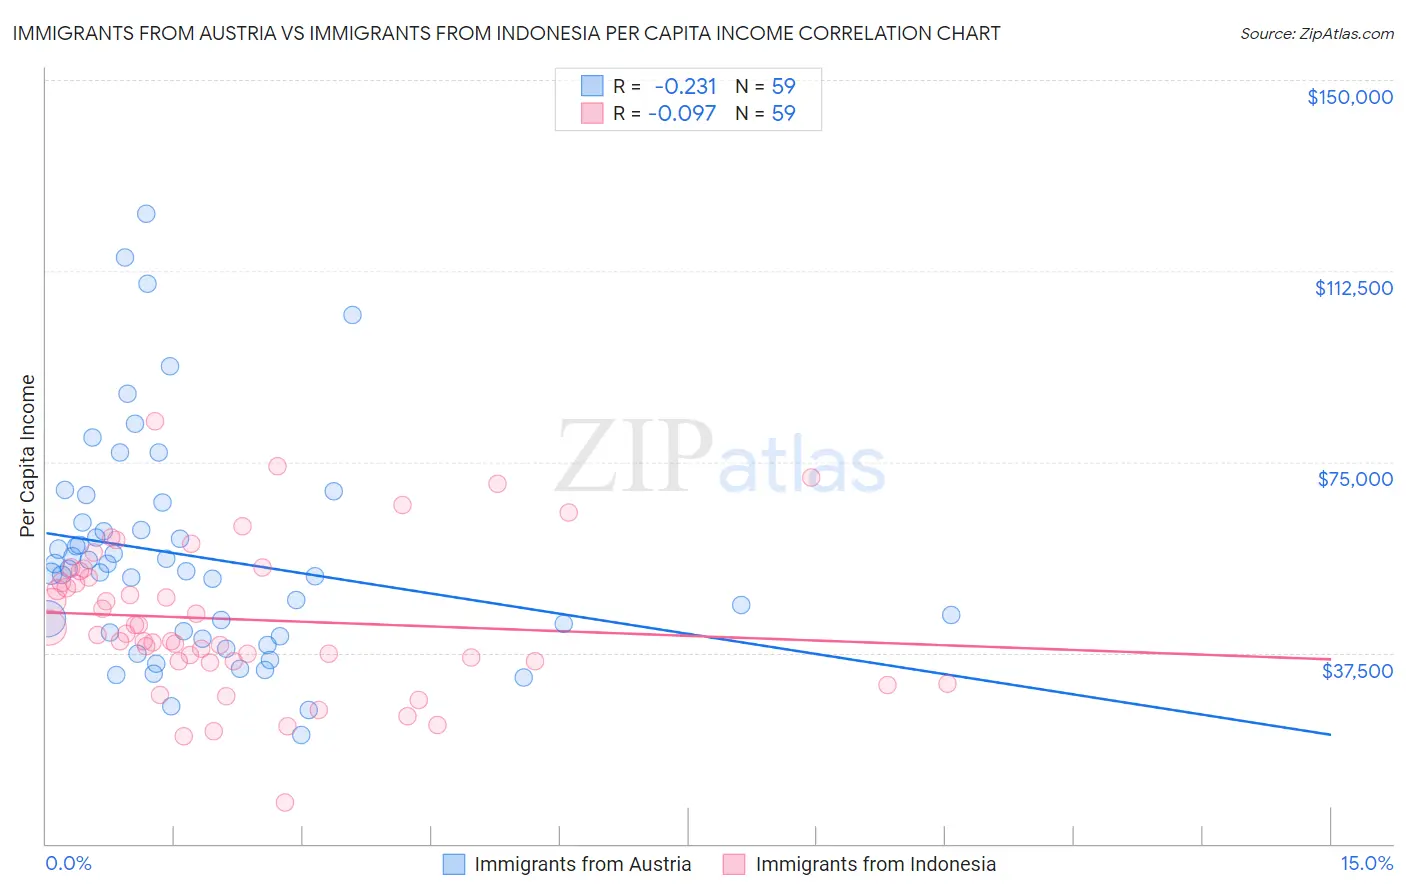
Immigrants from Austria vs Immigrants from Indonesia Per Capita Income Correlation Chart
The statistical analysis conducted on geographies consisting of 167,970,589 people shows a weak negative correlation between the proportion of Immigrants from Austria and per capita income in the United States with a correlation coefficient (R) of -0.231 and weighted average of $52,503. Similarly, the statistical analysis conducted on geographies consisting of 215,786,434 people shows a slight negative correlation between the proportion of Immigrants from Indonesia and per capita income in the United States with a correlation coefficient (R) of -0.097 and weighted average of $48,195, a difference of 8.9%.
Per Capita Income Correlation Summary
| Measurement | Immigrants from Austria | Immigrants from Indonesia |
| Minimum | $21,347 | $8,026 |
| Maximum | $123,682 | $82,949 |
| Range | $102,335 | $74,923 |
| Mean | $56,412 | $44,054 |
| Median | $53,535 | $41,336 |
| Interquartile 25% (IQ1) | $40,769 | $35,904 |
| Interquartile 75% (IQ3) | $63,066 | $53,591 |
| Interquartile Range (IQR) | $22,297 | $17,688 |
| Standard Deviation (Sample) | $21,800 | $14,587 |
| Standard Deviation (Population) | $21,614 | $14,462 |
Similar Demographics by Per Capita Income
Demographics Similar to Immigrants from Austria by Per Capita Income
In terms of per capita income, the demographic groups most similar to Immigrants from Austria are Israeli ($52,596, a difference of 0.18%), Turkish ($52,391, a difference of 0.21%), Latvian ($52,649, a difference of 0.28%), Immigrants from South Central Asia ($52,660, a difference of 0.30%), and Immigrants from Norway ($52,217, a difference of 0.55%).
| Demographics | Rating | Rank | Per Capita Income |
| Immigrants | Eastern Asia | 100.0 /100 | #23 | Exceptional $53,806 |
| Immigrants | Denmark | 100.0 /100 | #24 | Exceptional $53,799 |
| Immigrants | Japan | 100.0 /100 | #25 | Exceptional $53,359 |
| Russians | 100.0 /100 | #26 | Exceptional $53,154 |
| Immigrants | South Central Asia | 100.0 /100 | #27 | Exceptional $52,660 |
| Latvians | 100.0 /100 | #28 | Exceptional $52,649 |
| Israelis | 100.0 /100 | #29 | Exceptional $52,596 |
| Immigrants | Austria | 100.0 /100 | #30 | Exceptional $52,503 |
| Turks | 100.0 /100 | #31 | Exceptional $52,391 |
| Immigrants | Norway | 100.0 /100 | #32 | Exceptional $52,217 |
| Australians | 100.0 /100 | #33 | Exceptional $52,074 |
| Immigrants | Russia | 100.0 /100 | #34 | Exceptional $52,044 |
| Burmese | 100.0 /100 | #35 | Exceptional $52,005 |
| Immigrants | Greece | 100.0 /100 | #36 | Exceptional $51,891 |
| Estonians | 100.0 /100 | #37 | Exceptional $51,875 |
Demographics Similar to Immigrants from Indonesia by Per Capita Income
In terms of per capita income, the demographic groups most similar to Immigrants from Indonesia are Immigrants from Brazil ($48,164, a difference of 0.060%), Immigrants from Ukraine ($48,134, a difference of 0.13%), Austrian ($48,116, a difference of 0.16%), Armenian ($48,287, a difference of 0.19%), and Egyptian ($48,358, a difference of 0.34%).
| Demographics | Rating | Rank | Per Capita Income |
| Immigrants | Bolivia | 99.7 /100 | #75 | Exceptional $48,970 |
| Immigrants | England | 99.7 /100 | #76 | Exceptional $48,844 |
| Immigrants | Kazakhstan | 99.7 /100 | #77 | Exceptional $48,747 |
| Immigrants | Italy | 99.6 /100 | #78 | Exceptional $48,654 |
| Romanians | 99.5 /100 | #79 | Exceptional $48,445 |
| Egyptians | 99.5 /100 | #80 | Exceptional $48,358 |
| Armenians | 99.4 /100 | #81 | Exceptional $48,287 |
| Immigrants | Indonesia | 99.4 /100 | #82 | Exceptional $48,195 |
| Immigrants | Brazil | 99.4 /100 | #83 | Exceptional $48,164 |
| Immigrants | Ukraine | 99.3 /100 | #84 | Exceptional $48,134 |
| Austrians | 99.3 /100 | #85 | Exceptional $48,116 |
| Immigrants | Southern Europe | 99.3 /100 | #86 | Exceptional $48,027 |
| Ukrainians | 99.3 /100 | #87 | Exceptional $48,014 |
| Croatians | 99.0 /100 | #88 | Exceptional $47,742 |
| Northern Europeans | 98.9 /100 | #89 | Exceptional $47,698 |