Immigrants from Asia vs French Female Poverty Among 25-34 Year Olds
COMPARE
Immigrants from Asia
French
Female Poverty Among 25-34 Year Olds
Female Poverty Among 25-34 Year Olds Comparison
Immigrants from Asia
French
11.6%
FEMALE POVERTY AMONG 25-34 YEAR OLDS
99.9/ 100
METRIC RATING
32nd/ 347
METRIC RANK
14.3%
FEMALE POVERTY AMONG 25-34 YEAR OLDS
6.2/ 100
METRIC RATING
214th/ 347
METRIC RANK
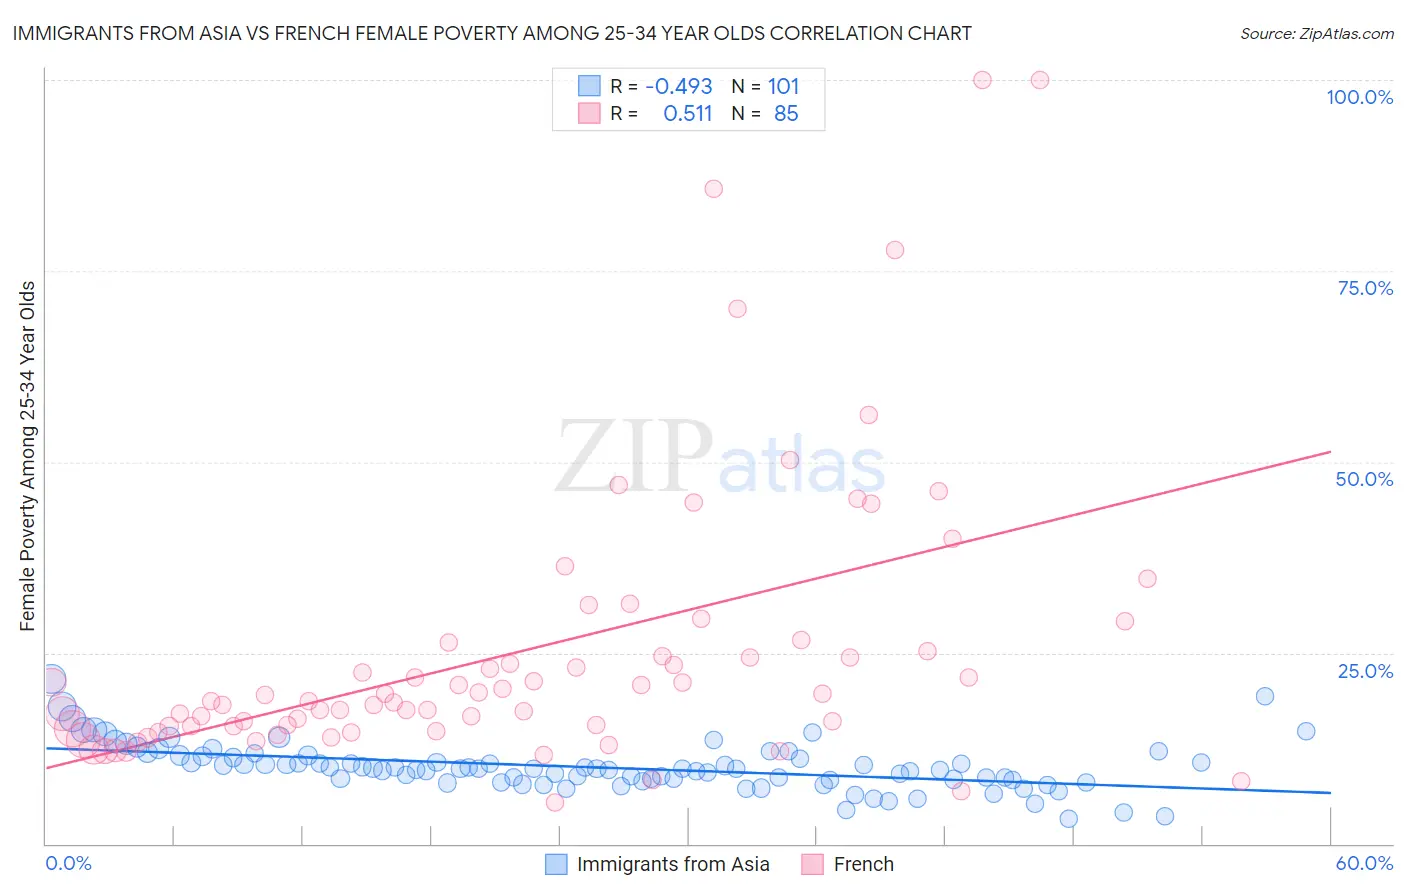
Immigrants from Asia vs French Female Poverty Among 25-34 Year Olds Correlation Chart
The statistical analysis conducted on geographies consisting of 531,620,237 people shows a moderate negative correlation between the proportion of Immigrants from Asia and poverty level among females between the ages 25 and 34 in the United States with a correlation coefficient (R) of -0.493 and weighted average of 11.6%. Similarly, the statistical analysis conducted on geographies consisting of 549,843,638 people shows a substantial positive correlation between the proportion of French and poverty level among females between the ages 25 and 34 in the United States with a correlation coefficient (R) of 0.511 and weighted average of 14.3%, a difference of 23.3%.
Female Poverty Among 25-34 Year Olds Correlation Summary
| Measurement | Immigrants from Asia | French |
| Minimum | 3.3% | 5.5% |
| Maximum | 21.5% | 100.0% |
| Range | 18.2% | 94.5% |
| Mean | 10.0% | 25.2% |
| Median | 9.8% | 18.7% |
| Interquartile 25% (IQ1) | 8.4% | 15.2% |
| Interquartile 75% (IQ3) | 11.4% | 25.8% |
| Interquartile Range (IQR) | 3.0% | 10.6% |
| Standard Deviation (Sample) | 3.0% | 18.7% |
| Standard Deviation (Population) | 3.0% | 18.6% |
Similar Demographics by Female Poverty Among 25-34 Year Olds
Demographics Similar to Immigrants from Asia by Female Poverty Among 25-34 Year Olds
In terms of female poverty among 25-34 year olds, the demographic groups most similar to Immigrants from Asia are Immigrants from Japan (11.6%, a difference of 0.30%), Immigrants from Poland (11.6%, a difference of 0.35%), Zimbabwean (11.7%, a difference of 0.57%), Cypriot (11.5%, a difference of 0.59%), and Immigrants from Pakistan (11.5%, a difference of 0.62%).
| Demographics | Rating | Rank | Female Poverty Among 25-34 Year Olds |
| Bhutanese | 99.9 /100 | #25 | Exceptional 11.4% |
| Tongans | 99.9 /100 | #26 | Exceptional 11.5% |
| Immigrants | Greece | 99.9 /100 | #27 | Exceptional 11.5% |
| Immigrants | Pakistan | 99.9 /100 | #28 | Exceptional 11.5% |
| Bulgarians | 99.9 /100 | #29 | Exceptional 11.5% |
| Cypriots | 99.9 /100 | #30 | Exceptional 11.5% |
| Immigrants | Japan | 99.9 /100 | #31 | Exceptional 11.6% |
| Immigrants | Asia | 99.9 /100 | #32 | Exceptional 11.6% |
| Immigrants | Poland | 99.9 /100 | #33 | Exceptional 11.6% |
| Zimbabweans | 99.9 /100 | #34 | Exceptional 11.7% |
| Cambodians | 99.9 /100 | #35 | Exceptional 11.7% |
| Immigrants | Sri Lanka | 99.8 /100 | #36 | Exceptional 11.8% |
| Taiwanese | 99.8 /100 | #37 | Exceptional 11.8% |
| Immigrants | North Macedonia | 99.8 /100 | #38 | Exceptional 11.8% |
| Latvians | 99.8 /100 | #39 | Exceptional 11.8% |
Demographics Similar to French by Female Poverty Among 25-34 Year Olds
In terms of female poverty among 25-34 year olds, the demographic groups most similar to French are Immigrants from Nigeria (14.3%, a difference of 0.020%), Puget Sound Salish (14.3%, a difference of 0.10%), Immigrants from Guyana (14.3%, a difference of 0.13%), French Canadian (14.3%, a difference of 0.27%), and Spanish American Indian (14.3%, a difference of 0.27%).
| Demographics | Rating | Rank | Female Poverty Among 25-34 Year Olds |
| Japanese | 11.7 /100 | #207 | Poor 14.1% |
| Immigrants | Panama | 11.6 /100 | #208 | Poor 14.1% |
| Guyanese | 8.6 /100 | #209 | Tragic 14.2% |
| Panamanians | 8.6 /100 | #210 | Tragic 14.2% |
| Trinidadians and Tobagonians | 8.2 /100 | #211 | Tragic 14.2% |
| Immigrants | Guyana | 6.6 /100 | #212 | Tragic 14.3% |
| Puget Sound Salish | 6.5 /100 | #213 | Tragic 14.3% |
| French | 6.2 /100 | #214 | Tragic 14.3% |
| Immigrants | Nigeria | 6.2 /100 | #215 | Tragic 14.3% |
| French Canadians | 5.5 /100 | #216 | Tragic 14.3% |
| Spanish American Indians | 5.5 /100 | #217 | Tragic 14.3% |
| Immigrants | Thailand | 5.2 /100 | #218 | Tragic 14.3% |
| Ecuadorians | 5.2 /100 | #219 | Tragic 14.3% |
| Ghanaians | 4.8 /100 | #220 | Tragic 14.4% |
| Sudanese | 4.4 /100 | #221 | Tragic 14.4% |