Immigrants from Argentina vs Immigrants from Panama Poverty
COMPARE
Immigrants from Argentina
Immigrants from Panama
Poverty
Poverty Comparison
Immigrants from Argentina
Immigrants from Panama
11.7%
POVERTY
88.0/ 100
METRIC RATING
127th/ 347
METRIC RANK
13.3%
POVERTY
4.1/ 100
METRIC RATING
213th/ 347
METRIC RANK
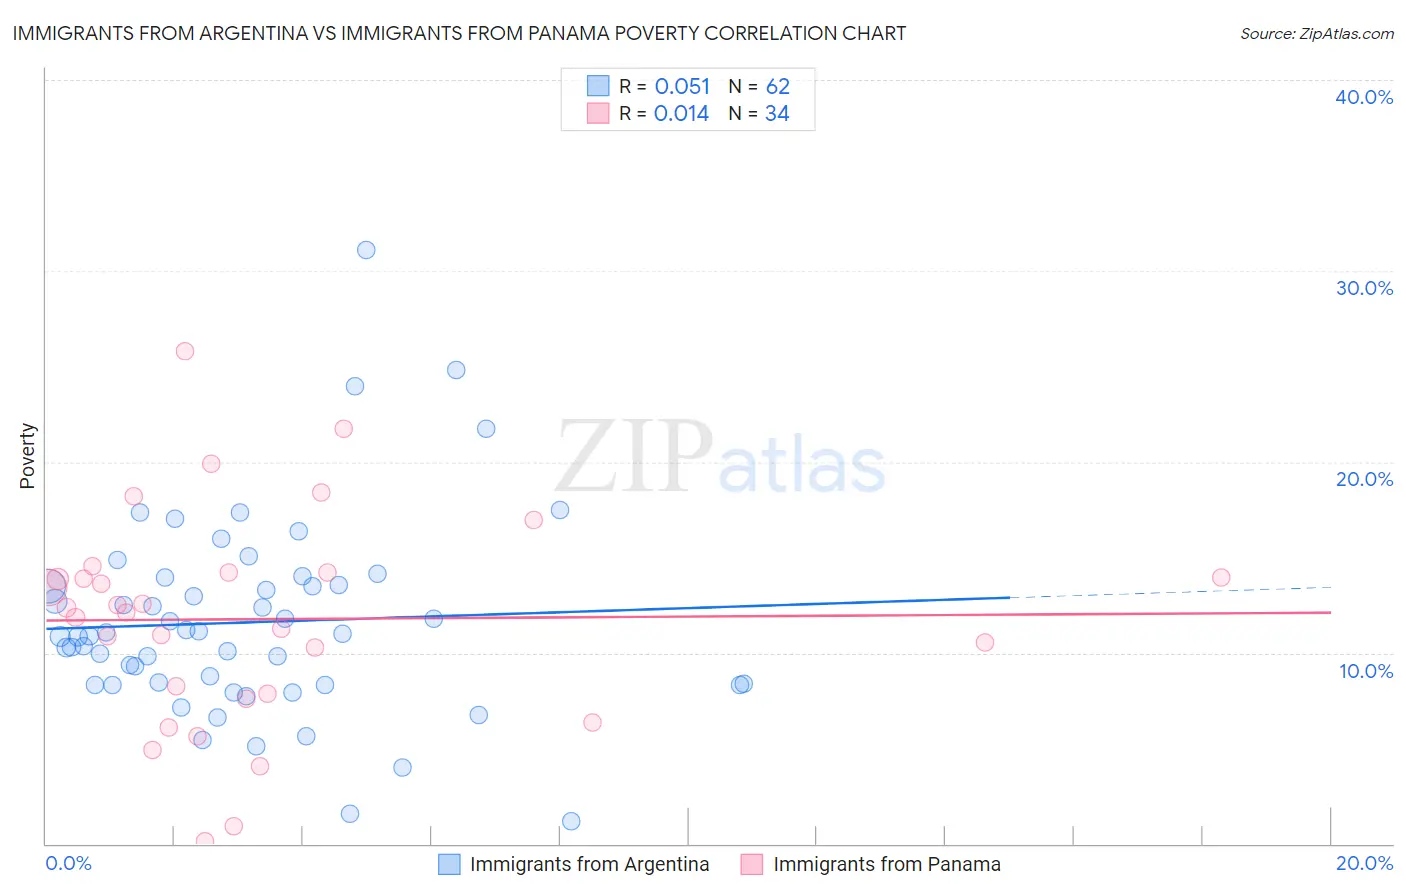
Immigrants from Argentina vs Immigrants from Panama Poverty Correlation Chart
The statistical analysis conducted on geographies consisting of 264,354,421 people shows a slight positive correlation between the proportion of Immigrants from Argentina and poverty level in the United States with a correlation coefficient (R) of 0.051 and weighted average of 11.7%. Similarly, the statistical analysis conducted on geographies consisting of 221,154,793 people shows no correlation between the proportion of Immigrants from Panama and poverty level in the United States with a correlation coefficient (R) of 0.014 and weighted average of 13.3%, a difference of 13.1%.
Poverty Correlation Summary
| Measurement | Immigrants from Argentina | Immigrants from Panama |
| Minimum | 1.2% | 0.14% |
| Maximum | 31.1% | 25.8% |
| Range | 29.9% | 25.7% |
| Mean | 11.6% | 11.8% |
| Median | 10.9% | 12.2% |
| Interquartile 25% (IQ1) | 8.3% | 7.9% |
| Interquartile 75% (IQ3) | 13.6% | 14.2% |
| Interquartile Range (IQR) | 5.2% | 6.4% |
| Standard Deviation (Sample) | 5.2% | 5.6% |
| Standard Deviation (Population) | 5.1% | 5.5% |
Similar Demographics by Poverty
Demographics Similar to Immigrants from Argentina by Poverty
In terms of poverty, the demographic groups most similar to Immigrants from Argentina are Immigrants from Norway (11.7%, a difference of 0.020%), Immigrants from Brazil (11.7%, a difference of 0.060%), Soviet Union (11.7%, a difference of 0.10%), Immigrants from Israel (11.7%, a difference of 0.13%), and Immigrants from Hungary (11.7%, a difference of 0.17%).
| Demographics | Rating | Rank | Poverty |
| Immigrants | South Eastern Asia | 88.9 /100 | #120 | Excellent 11.7% |
| New Zealanders | 88.7 /100 | #121 | Excellent 11.7% |
| Puget Sound Salish | 88.7 /100 | #122 | Excellent 11.7% |
| Immigrants | Hungary | 88.6 /100 | #123 | Excellent 11.7% |
| Soviet Union | 88.4 /100 | #124 | Excellent 11.7% |
| Immigrants | Brazil | 88.2 /100 | #125 | Excellent 11.7% |
| Immigrants | Norway | 88.0 /100 | #126 | Excellent 11.7% |
| Immigrants | Argentina | 88.0 /100 | #127 | Excellent 11.7% |
| Immigrants | Israel | 87.4 /100 | #128 | Excellent 11.7% |
| South Africans | 87.0 /100 | #129 | Excellent 11.7% |
| Immigrants | Ukraine | 86.6 /100 | #130 | Excellent 11.8% |
| French | 86.1 /100 | #131 | Excellent 11.8% |
| Peruvians | 85.6 /100 | #132 | Excellent 11.8% |
| Immigrants | Western Europe | 85.2 /100 | #133 | Excellent 11.8% |
| Yugoslavians | 85.2 /100 | #134 | Excellent 11.8% |
Demographics Similar to Immigrants from Panama by Poverty
In terms of poverty, the demographic groups most similar to Immigrants from Panama are Immigrants (13.2%, a difference of 0.13%), Bermudan (13.3%, a difference of 0.25%), Japanese (13.3%, a difference of 0.51%), Nonimmigrants (13.3%, a difference of 0.51%), and Immigrants from Uzbekistan (13.3%, a difference of 0.55%).
| Demographics | Rating | Rank | Poverty |
| Immigrants | Eastern Africa | 7.0 /100 | #206 | Tragic 13.1% |
| Panamanians | 6.6 /100 | #207 | Tragic 13.1% |
| Ugandans | 6.2 /100 | #208 | Tragic 13.1% |
| Malaysians | 6.1 /100 | #209 | Tragic 13.1% |
| Immigrants | Azores | 6.1 /100 | #210 | Tragic 13.1% |
| Moroccans | 5.2 /100 | #211 | Tragic 13.2% |
| Immigrants | Immigrants | 4.3 /100 | #212 | Tragic 13.2% |
| Immigrants | Panama | 4.1 /100 | #213 | Tragic 13.3% |
| Bermudans | 3.7 /100 | #214 | Tragic 13.3% |
| Japanese | 3.3 /100 | #215 | Tragic 13.3% |
| Immigrants | Nonimmigrants | 3.3 /100 | #216 | Tragic 13.3% |
| Immigrants | Uzbekistan | 3.2 /100 | #217 | Tragic 13.3% |
| Immigrants | Thailand | 3.1 /100 | #218 | Tragic 13.3% |
| Immigrants | Cambodia | 3.0 /100 | #219 | Tragic 13.4% |
| Americans | 2.9 /100 | #220 | Tragic 13.4% |