Immigrants from Africa vs Indian (Asian) Female Poverty Among 25-34 Year Olds
COMPARE
Immigrants from Africa
Indian (Asian)
Female Poverty Among 25-34 Year Olds
Female Poverty Among 25-34 Year Olds Comparison
Immigrants from Africa
Indians (Asian)
14.1%
FEMALE POVERTY AMONG 25-34 YEAR OLDS
13.4/ 100
METRIC RATING
205th/ 347
METRIC RANK
11.2%
FEMALE POVERTY AMONG 25-34 YEAR OLDS
100.0/ 100
METRIC RATING
14th/ 347
METRIC RANK
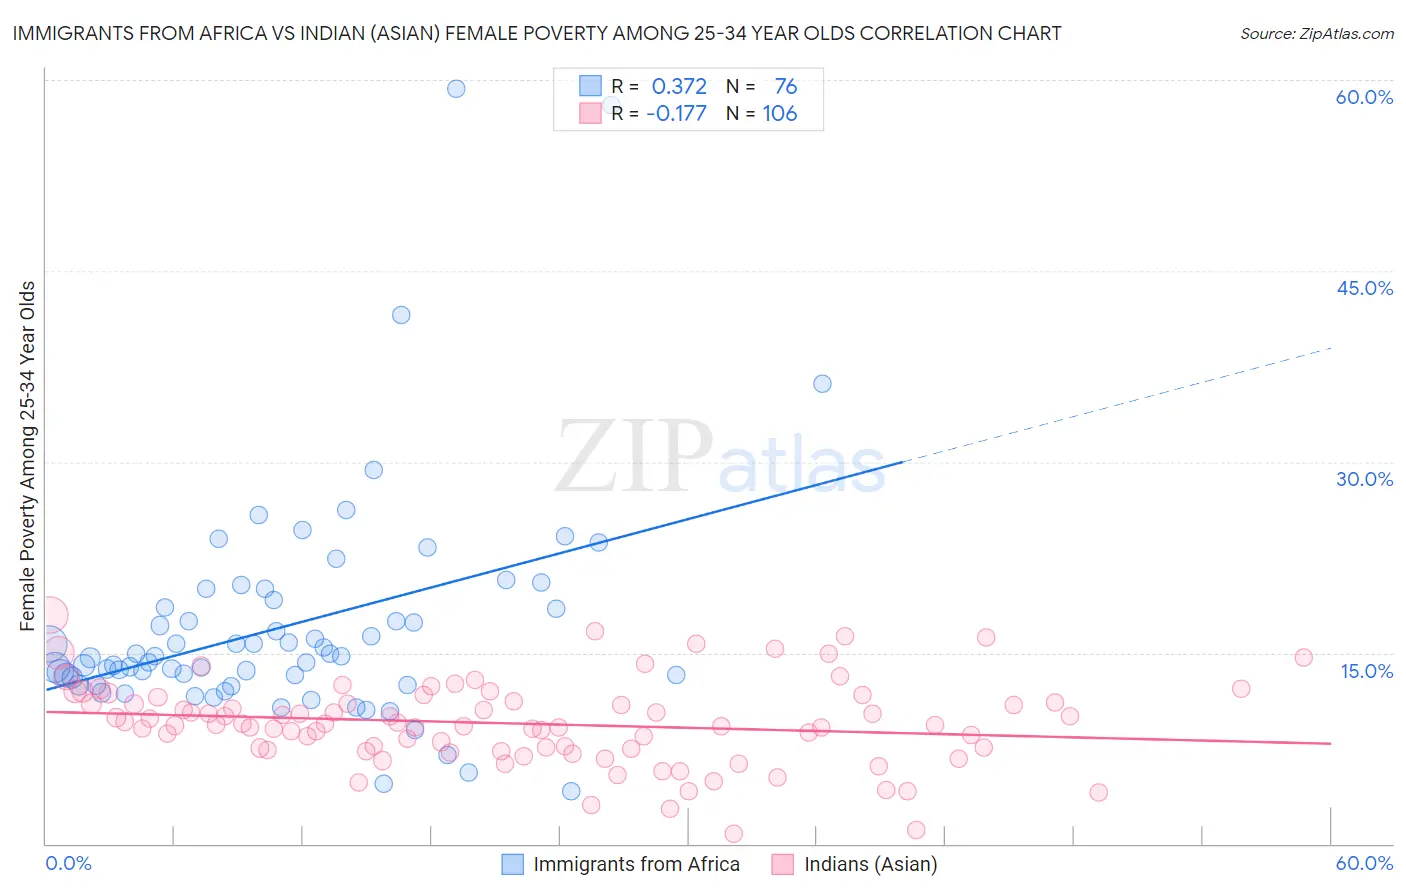
Immigrants from Africa vs Indian (Asian) Female Poverty Among 25-34 Year Olds Correlation Chart
The statistical analysis conducted on geographies consisting of 459,678,393 people shows a mild positive correlation between the proportion of Immigrants from Africa and poverty level among females between the ages 25 and 34 in the United States with a correlation coefficient (R) of 0.372 and weighted average of 14.1%. Similarly, the statistical analysis conducted on geographies consisting of 482,719,259 people shows a poor negative correlation between the proportion of Indians (Asian) and poverty level among females between the ages 25 and 34 in the United States with a correlation coefficient (R) of -0.177 and weighted average of 11.2%, a difference of 25.8%.
Female Poverty Among 25-34 Year Olds Correlation Summary
| Measurement | Immigrants from Africa | Indian (Asian) |
| Minimum | 4.1% | 0.78% |
| Maximum | 59.3% | 18.0% |
| Range | 55.2% | 17.2% |
| Mean | 17.1% | 9.4% |
| Median | 14.7% | 9.3% |
| Interquartile 25% (IQ1) | 12.8% | 7.4% |
| Interquartile 75% (IQ3) | 18.9% | 11.2% |
| Interquartile Range (IQR) | 6.1% | 3.8% |
| Standard Deviation (Sample) | 9.2% | 3.3% |
| Standard Deviation (Population) | 9.2% | 3.3% |
Similar Demographics by Female Poverty Among 25-34 Year Olds
Demographics Similar to Immigrants from Africa by Female Poverty Among 25-34 Year Olds
In terms of female poverty among 25-34 year olds, the demographic groups most similar to Immigrants from Africa are Hawaiian (14.1%, a difference of 0.050%), Immigrants (14.0%, a difference of 0.19%), Hungarian (14.1%, a difference of 0.28%), Japanese (14.1%, a difference of 0.30%), and Immigrants from Panama (14.1%, a difference of 0.32%).
| Demographics | Rating | Rank | Female Poverty Among 25-34 Year Olds |
| Immigrants | Germany | 20.9 /100 | #198 | Fair 13.9% |
| English | 20.4 /100 | #199 | Fair 13.9% |
| Hmong | 20.3 /100 | #200 | Fair 13.9% |
| Immigrants | Trinidad and Tobago | 17.6 /100 | #201 | Poor 14.0% |
| Welsh | 17.2 /100 | #202 | Poor 14.0% |
| Immigrants | Immigrants | 14.5 /100 | #203 | Poor 14.0% |
| Hawaiians | 13.6 /100 | #204 | Poor 14.1% |
| Immigrants | Africa | 13.4 /100 | #205 | Poor 14.1% |
| Hungarians | 11.8 /100 | #206 | Poor 14.1% |
| Japanese | 11.7 /100 | #207 | Poor 14.1% |
| Immigrants | Panama | 11.6 /100 | #208 | Poor 14.1% |
| Guyanese | 8.6 /100 | #209 | Tragic 14.2% |
| Panamanians | 8.6 /100 | #210 | Tragic 14.2% |
| Trinidadians and Tobagonians | 8.2 /100 | #211 | Tragic 14.2% |
| Immigrants | Guyana | 6.6 /100 | #212 | Tragic 14.3% |
Demographics Similar to Indians (Asian) by Female Poverty Among 25-34 Year Olds
In terms of female poverty among 25-34 year olds, the demographic groups most similar to Indians (Asian) are Burmese (11.2%, a difference of 0.010%), Immigrants from Ireland (11.2%, a difference of 0.11%), Assyrian/Chaldean/Syriac (11.2%, a difference of 0.11%), Immigrants from Bolivia (11.2%, a difference of 0.15%), and Immigrants from China (11.2%, a difference of 0.21%).
| Demographics | Rating | Rank | Female Poverty Among 25-34 Year Olds |
| Chinese | 100.0 /100 | #7 | Exceptional 11.0% |
| Immigrants | Iran | 100.0 /100 | #8 | Exceptional 11.0% |
| Immigrants | Singapore | 100.0 /100 | #9 | Exceptional 11.1% |
| Immigrants | Lithuania | 100.0 /100 | #10 | Exceptional 11.1% |
| Immigrants | Korea | 100.0 /100 | #11 | Exceptional 11.1% |
| Immigrants | Ireland | 100.0 /100 | #12 | Exceptional 11.2% |
| Burmese | 100.0 /100 | #13 | Exceptional 11.2% |
| Indians (Asian) | 100.0 /100 | #14 | Exceptional 11.2% |
| Assyrians/Chaldeans/Syriacs | 100.0 /100 | #15 | Exceptional 11.2% |
| Immigrants | Bolivia | 100.0 /100 | #16 | Exceptional 11.2% |
| Immigrants | China | 100.0 /100 | #17 | Exceptional 11.2% |
| Immigrants | Eastern Asia | 100.0 /100 | #18 | Exceptional 11.2% |
| Iranians | 100.0 /100 | #19 | Exceptional 11.2% |
| Okinawans | 100.0 /100 | #20 | Exceptional 11.3% |
| Turks | 100.0 /100 | #21 | Exceptional 11.4% |