Syrian vs Indian (Asian) Female Poverty Among 25-34 Year Olds
COMPARE
Syrian
Indian (Asian)
Female Poverty Among 25-34 Year Olds
Female Poverty Among 25-34 Year Olds Comparison
Syrians
Indians (Asian)
12.9%
FEMALE POVERTY AMONG 25-34 YEAR OLDS
90.2/ 100
METRIC RATING
128th/ 347
METRIC RANK
11.2%
FEMALE POVERTY AMONG 25-34 YEAR OLDS
100.0/ 100
METRIC RATING
14th/ 347
METRIC RANK
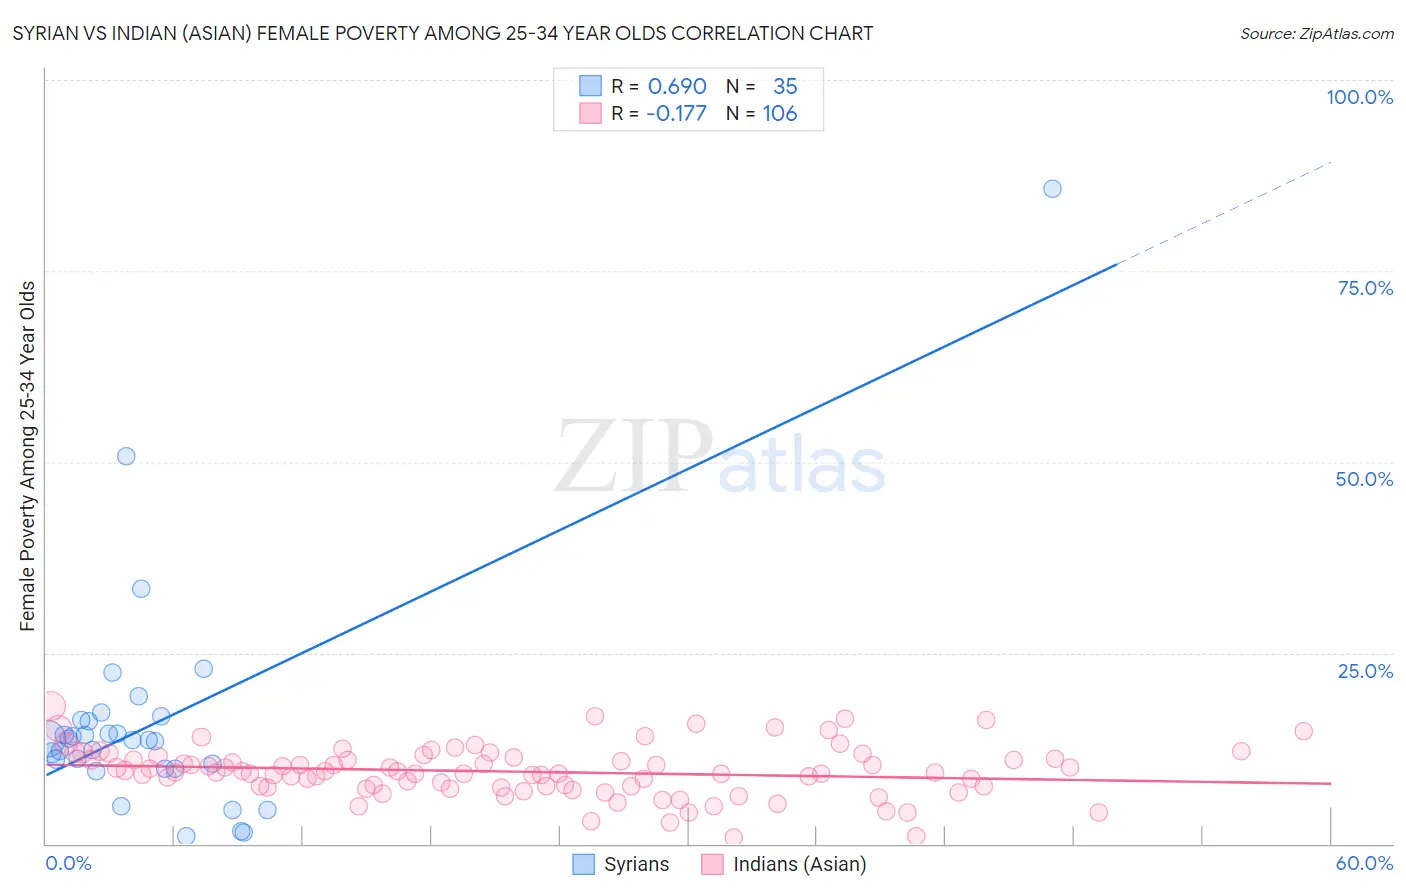
Syrian vs Indian (Asian) Female Poverty Among 25-34 Year Olds Correlation Chart
The statistical analysis conducted on geographies consisting of 262,724,041 people shows a significant positive correlation between the proportion of Syrians and poverty level among females between the ages 25 and 34 in the United States with a correlation coefficient (R) of 0.690 and weighted average of 12.9%. Similarly, the statistical analysis conducted on geographies consisting of 482,719,259 people shows a poor negative correlation between the proportion of Indians (Asian) and poverty level among females between the ages 25 and 34 in the United States with a correlation coefficient (R) of -0.177 and weighted average of 11.2%, a difference of 15.5%.
Female Poverty Among 25-34 Year Olds Correlation Summary
| Measurement | Syrian | Indian (Asian) |
| Minimum | 0.91% | 0.78% |
| Maximum | 85.7% | 18.0% |
| Range | 84.8% | 17.2% |
| Mean | 15.9% | 9.4% |
| Median | 13.5% | 9.3% |
| Interquartile 25% (IQ1) | 9.9% | 7.4% |
| Interquartile 75% (IQ3) | 16.2% | 11.2% |
| Interquartile Range (IQR) | 6.3% | 3.8% |
| Standard Deviation (Sample) | 15.1% | 3.3% |
| Standard Deviation (Population) | 14.9% | 3.3% |
Similar Demographics by Female Poverty Among 25-34 Year Olds
Demographics Similar to Syrians by Female Poverty Among 25-34 Year Olds
In terms of female poverty among 25-34 year olds, the demographic groups most similar to Syrians are Czech (12.9%, a difference of 0.020%), Immigrants from North America (12.9%, a difference of 0.12%), Immigrants from Uzbekistan (12.9%, a difference of 0.14%), Immigrants from Fiji (12.9%, a difference of 0.25%), and Immigrants from Canada (12.9%, a difference of 0.33%).
| Demographics | Rating | Rank | Female Poverty Among 25-34 Year Olds |
| Romanians | 92.8 /100 | #121 | Exceptional 12.8% |
| Immigrants | Western Asia | 92.7 /100 | #122 | Exceptional 12.8% |
| Slovenes | 92.7 /100 | #123 | Exceptional 12.8% |
| Immigrants | Netherlands | 92.0 /100 | #124 | Exceptional 12.8% |
| Immigrants | Canada | 91.5 /100 | #125 | Exceptional 12.9% |
| Immigrants | Fiji | 91.2 /100 | #126 | Exceptional 12.9% |
| Czechs | 90.3 /100 | #127 | Exceptional 12.9% |
| Syrians | 90.2 /100 | #128 | Exceptional 12.9% |
| Immigrants | North America | 89.7 /100 | #129 | Excellent 12.9% |
| Immigrants | Uzbekistan | 89.6 /100 | #130 | Excellent 12.9% |
| Pakistanis | 88.4 /100 | #131 | Excellent 13.0% |
| Immigrants | Hungary | 88.3 /100 | #132 | Excellent 13.0% |
| Serbians | 87.6 /100 | #133 | Excellent 13.0% |
| Afghans | 85.8 /100 | #134 | Excellent 13.0% |
| South Africans | 85.7 /100 | #135 | Excellent 13.0% |
Demographics Similar to Indians (Asian) by Female Poverty Among 25-34 Year Olds
In terms of female poverty among 25-34 year olds, the demographic groups most similar to Indians (Asian) are Burmese (11.2%, a difference of 0.010%), Immigrants from Ireland (11.2%, a difference of 0.11%), Assyrian/Chaldean/Syriac (11.2%, a difference of 0.11%), Immigrants from Bolivia (11.2%, a difference of 0.15%), and Immigrants from China (11.2%, a difference of 0.21%).
| Demographics | Rating | Rank | Female Poverty Among 25-34 Year Olds |
| Chinese | 100.0 /100 | #7 | Exceptional 11.0% |
| Immigrants | Iran | 100.0 /100 | #8 | Exceptional 11.0% |
| Immigrants | Singapore | 100.0 /100 | #9 | Exceptional 11.1% |
| Immigrants | Lithuania | 100.0 /100 | #10 | Exceptional 11.1% |
| Immigrants | Korea | 100.0 /100 | #11 | Exceptional 11.1% |
| Immigrants | Ireland | 100.0 /100 | #12 | Exceptional 11.2% |
| Burmese | 100.0 /100 | #13 | Exceptional 11.2% |
| Indians (Asian) | 100.0 /100 | #14 | Exceptional 11.2% |
| Assyrians/Chaldeans/Syriacs | 100.0 /100 | #15 | Exceptional 11.2% |
| Immigrants | Bolivia | 100.0 /100 | #16 | Exceptional 11.2% |
| Immigrants | China | 100.0 /100 | #17 | Exceptional 11.2% |
| Immigrants | Eastern Asia | 100.0 /100 | #18 | Exceptional 11.2% |
| Iranians | 100.0 /100 | #19 | Exceptional 11.2% |
| Okinawans | 100.0 /100 | #20 | Exceptional 11.3% |
| Turks | 100.0 /100 | #21 | Exceptional 11.4% |