Immigrants from Africa vs Indian (Asian) 1st Grade
COMPARE
Immigrants from Africa
Indian (Asian)
1st Grade
1st Grade Comparison
Immigrants from Africa
Indians (Asian)
97.6%
1ST GRADE
0.9/ 100
METRIC RATING
252nd/ 347
METRIC RANK
97.5%
1ST GRADE
0.6/ 100
METRIC RATING
258th/ 347
METRIC RANK
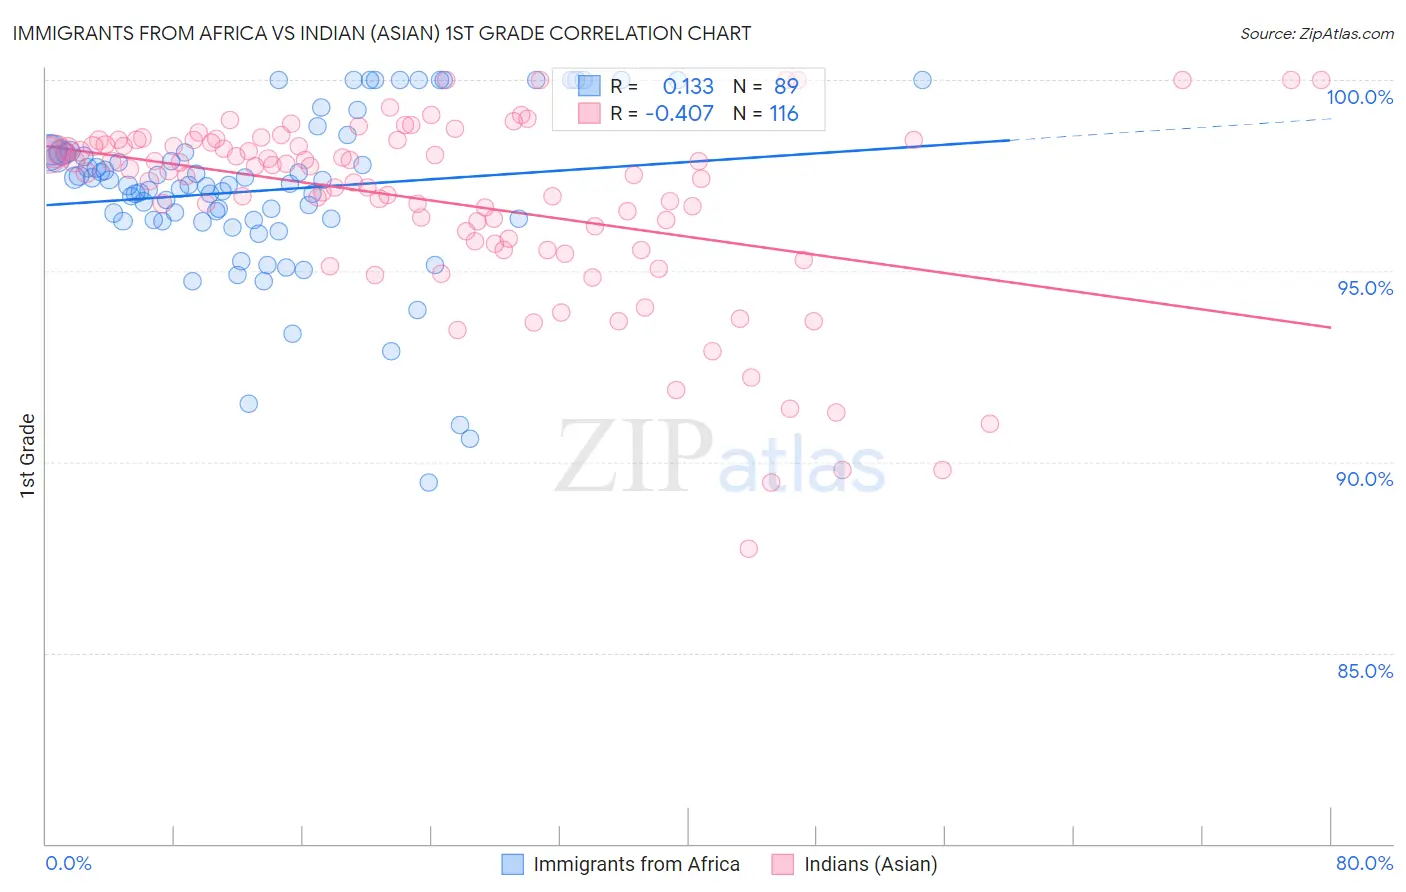
Immigrants from Africa vs Indian (Asian) 1st Grade Correlation Chart
The statistical analysis conducted on geographies consisting of 469,440,174 people shows a poor positive correlation between the proportion of Immigrants from Africa and percentage of population with at least 1st grade education in the United States with a correlation coefficient (R) of 0.133 and weighted average of 97.6%. Similarly, the statistical analysis conducted on geographies consisting of 495,287,818 people shows a moderate negative correlation between the proportion of Indians (Asian) and percentage of population with at least 1st grade education in the United States with a correlation coefficient (R) of -0.407 and weighted average of 97.5%, a difference of 0.030%.
1st Grade Correlation Summary
| Measurement | Immigrants from Africa | Indian (Asian) |
| Minimum | 89.5% | 87.7% |
| Maximum | 100.0% | 100.0% |
| Range | 10.5% | 12.3% |
| Mean | 97.1% | 96.8% |
| Median | 97.3% | 97.6% |
| Interquartile 25% (IQ1) | 96.3% | 95.8% |
| Interquartile 75% (IQ3) | 98.1% | 98.4% |
| Interquartile Range (IQR) | 1.8% | 2.6% |
| Standard Deviation (Sample) | 2.2% | 2.4% |
| Standard Deviation (Population) | 2.1% | 2.4% |
Demographics Similar to Immigrants from Africa and Indians (Asian) by 1st Grade
In terms of 1st grade, the demographic groups most similar to Immigrants from Africa are Immigrants from Iraq (97.6%, a difference of 0.0%), Peruvian (97.6%, a difference of 0.010%), Immigrants from Middle Africa (97.6%, a difference of 0.010%), Immigrants from Senegal (97.6%, a difference of 0.010%), and Ethiopian (97.6%, a difference of 0.010%). Similarly, the demographic groups most similar to Indians (Asian) are Jamaican (97.5%, a difference of 0.0%), Yaqui (97.5%, a difference of 0.0%), Immigrants from Colombia (97.5%, a difference of 0.010%), Fijian (97.5%, a difference of 0.010%), and Armenian (97.5%, a difference of 0.010%).
| Demographics | Rating | Rank | 1st Grade |
| South Americans | 1.1 /100 | #245 | Tragic 97.6% |
| Immigrants | Eastern Africa | 1.0 /100 | #246 | Tragic 97.6% |
| Peruvians | 1.0 /100 | #247 | Tragic 97.6% |
| Immigrants | Middle Africa | 1.0 /100 | #248 | Tragic 97.6% |
| Immigrants | Senegal | 1.0 /100 | #249 | Tragic 97.6% |
| Ethiopians | 0.9 /100 | #250 | Tragic 97.6% |
| Immigrants | Iraq | 0.9 /100 | #251 | Tragic 97.6% |
| Immigrants | Africa | 0.9 /100 | #252 | Tragic 97.6% |
| Immigrants | Congo | 0.7 /100 | #253 | Tragic 97.5% |
| Immigrants | Asia | 0.7 /100 | #254 | Tragic 97.5% |
| Immigrants | Colombia | 0.6 /100 | #255 | Tragic 97.5% |
| Jamaicans | 0.6 /100 | #256 | Tragic 97.5% |
| Yaqui | 0.6 /100 | #257 | Tragic 97.5% |
| Indians (Asian) | 0.6 /100 | #258 | Tragic 97.5% |
| Fijians | 0.5 /100 | #259 | Tragic 97.5% |
| Armenians | 0.5 /100 | #260 | Tragic 97.5% |
| Immigrants | Ethiopia | 0.4 /100 | #261 | Tragic 97.5% |
| Assyrians/Chaldeans/Syriacs | 0.4 /100 | #262 | Tragic 97.5% |
| Immigrants | South America | 0.4 /100 | #263 | Tragic 97.5% |
| Taiwanese | 0.4 /100 | #264 | Tragic 97.5% |
| Cubans | 0.3 /100 | #265 | Tragic 97.5% |