Immigrants from Africa vs Bahamian Female Poverty Among 25-34 Year Olds
COMPARE
Immigrants from Africa
Bahamian
Female Poverty Among 25-34 Year Olds
Female Poverty Among 25-34 Year Olds Comparison
Immigrants from Africa
Bahamians
14.1%
FEMALE POVERTY AMONG 25-34 YEAR OLDS
13.4/ 100
METRIC RATING
205th/ 347
METRIC RANK
16.1%
FEMALE POVERTY AMONG 25-34 YEAR OLDS
0.0/ 100
METRIC RATING
283rd/ 347
METRIC RANK
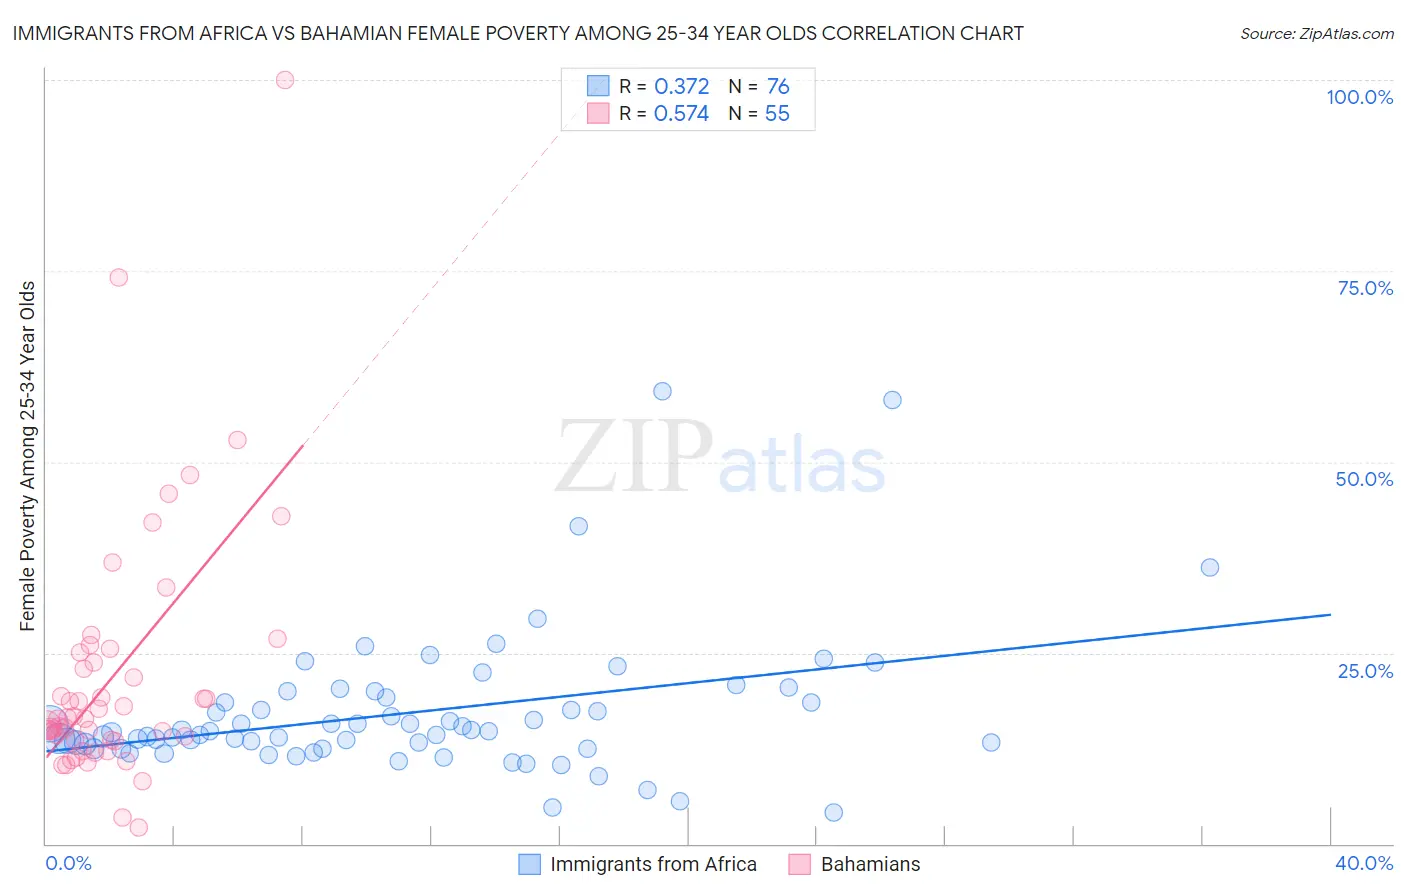
Immigrants from Africa vs Bahamian Female Poverty Among 25-34 Year Olds Correlation Chart
The statistical analysis conducted on geographies consisting of 459,678,393 people shows a mild positive correlation between the proportion of Immigrants from Africa and poverty level among females between the ages 25 and 34 in the United States with a correlation coefficient (R) of 0.372 and weighted average of 14.1%. Similarly, the statistical analysis conducted on geographies consisting of 112,200,986 people shows a substantial positive correlation between the proportion of Bahamians and poverty level among females between the ages 25 and 34 in the United States with a correlation coefficient (R) of 0.574 and weighted average of 16.1%, a difference of 14.5%.
Female Poverty Among 25-34 Year Olds Correlation Summary
| Measurement | Immigrants from Africa | Bahamian |
| Minimum | 4.1% | 2.1% |
| Maximum | 59.3% | 100.0% |
| Range | 55.2% | 97.9% |
| Mean | 17.1% | 22.0% |
| Median | 14.7% | 16.4% |
| Interquartile 25% (IQ1) | 12.8% | 13.6% |
| Interquartile 75% (IQ3) | 18.9% | 25.1% |
| Interquartile Range (IQR) | 6.1% | 11.5% |
| Standard Deviation (Sample) | 9.2% | 16.8% |
| Standard Deviation (Population) | 9.2% | 16.7% |
Similar Demographics by Female Poverty Among 25-34 Year Olds
Demographics Similar to Immigrants from Africa by Female Poverty Among 25-34 Year Olds
In terms of female poverty among 25-34 year olds, the demographic groups most similar to Immigrants from Africa are Hawaiian (14.1%, a difference of 0.050%), Immigrants (14.0%, a difference of 0.19%), Hungarian (14.1%, a difference of 0.28%), Japanese (14.1%, a difference of 0.30%), and Immigrants from Panama (14.1%, a difference of 0.32%).
| Demographics | Rating | Rank | Female Poverty Among 25-34 Year Olds |
| Immigrants | Germany | 20.9 /100 | #198 | Fair 13.9% |
| English | 20.4 /100 | #199 | Fair 13.9% |
| Hmong | 20.3 /100 | #200 | Fair 13.9% |
| Immigrants | Trinidad and Tobago | 17.6 /100 | #201 | Poor 14.0% |
| Welsh | 17.2 /100 | #202 | Poor 14.0% |
| Immigrants | Immigrants | 14.5 /100 | #203 | Poor 14.0% |
| Hawaiians | 13.6 /100 | #204 | Poor 14.1% |
| Immigrants | Africa | 13.4 /100 | #205 | Poor 14.1% |
| Hungarians | 11.8 /100 | #206 | Poor 14.1% |
| Japanese | 11.7 /100 | #207 | Poor 14.1% |
| Immigrants | Panama | 11.6 /100 | #208 | Poor 14.1% |
| Guyanese | 8.6 /100 | #209 | Tragic 14.2% |
| Panamanians | 8.6 /100 | #210 | Tragic 14.2% |
| Trinidadians and Tobagonians | 8.2 /100 | #211 | Tragic 14.2% |
| Immigrants | Guyana | 6.6 /100 | #212 | Tragic 14.3% |
Demographics Similar to Bahamians by Female Poverty Among 25-34 Year Olds
In terms of female poverty among 25-34 year olds, the demographic groups most similar to Bahamians are Aleut (16.1%, a difference of 0.030%), Immigrants from Latin America (16.0%, a difference of 0.69%), Shoshone (16.2%, a difference of 0.83%), Bangladeshi (15.9%, a difference of 1.2%), and Immigrants from Bahamas (16.3%, a difference of 1.3%).
| Demographics | Rating | Rank | Female Poverty Among 25-34 Year Olds |
| Immigrants | Zaire | 0.0 /100 | #276 | Tragic 15.8% |
| Immigrants | Micronesia | 0.0 /100 | #277 | Tragic 15.8% |
| French American Indians | 0.0 /100 | #278 | Tragic 15.9% |
| Fijians | 0.0 /100 | #279 | Tragic 15.9% |
| Bangladeshis | 0.0 /100 | #280 | Tragic 15.9% |
| Immigrants | Latin America | 0.0 /100 | #281 | Tragic 16.0% |
| Aleuts | 0.0 /100 | #282 | Tragic 16.1% |
| Bahamians | 0.0 /100 | #283 | Tragic 16.1% |
| Shoshone | 0.0 /100 | #284 | Tragic 16.2% |
| Immigrants | Bahamas | 0.0 /100 | #285 | Tragic 16.3% |
| Cape Verdeans | 0.0 /100 | #286 | Tragic 16.3% |
| Americans | 0.0 /100 | #287 | Tragic 16.4% |
| Guatemalans | 0.0 /100 | #288 | Tragic 16.4% |
| Osage | 0.0 /100 | #289 | Tragic 16.4% |
| Indonesians | 0.0 /100 | #290 | Tragic 16.4% |