Immigrants from India vs Immigrants from Liberia Female Poverty Among 18-24 Year Olds
COMPARE
Immigrants from India
Immigrants from Liberia
Female Poverty Among 18-24 Year Olds
Female Poverty Among 18-24 Year Olds Comparison
Immigrants from India
Immigrants from Liberia
16.4%
FEMALE POVERTY AMONG 18-24 YEAR OLDS
100.0/ 100
METRIC RATING
4th/ 347
METRIC RANK
20.7%
FEMALE POVERTY AMONG 18-24 YEAR OLDS
7.6/ 100
METRIC RATING
224th/ 347
METRIC RANK
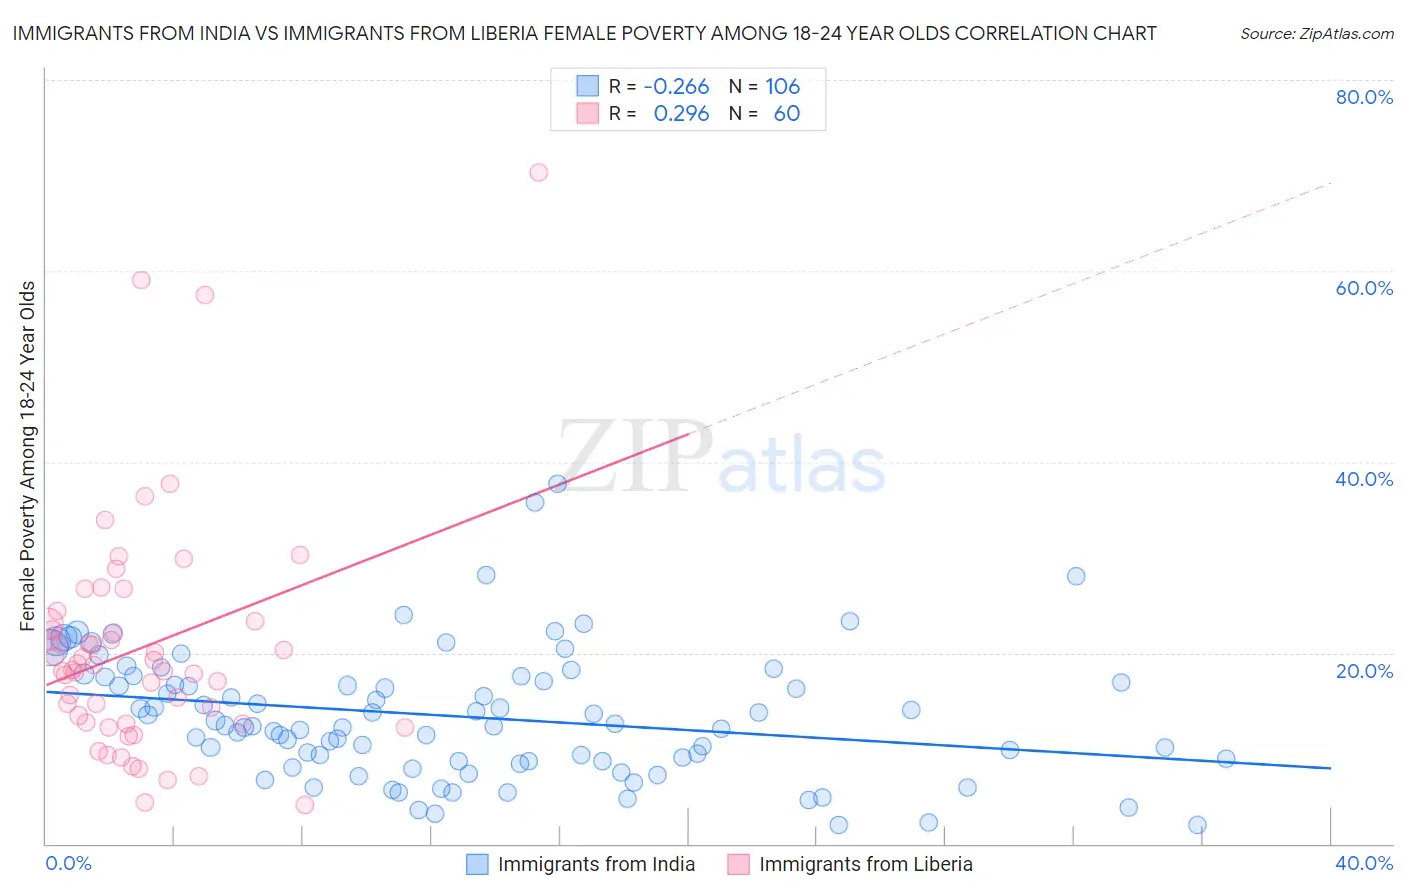
Immigrants from India vs Immigrants from Liberia Female Poverty Among 18-24 Year Olds Correlation Chart
The statistical analysis conducted on geographies consisting of 421,547,440 people shows a weak negative correlation between the proportion of Immigrants from India and poverty level among females between the ages 18 and 24 in the United States with a correlation coefficient (R) of -0.266 and weighted average of 16.4%. Similarly, the statistical analysis conducted on geographies consisting of 134,229,994 people shows a weak positive correlation between the proportion of Immigrants from Liberia and poverty level among females between the ages 18 and 24 in the United States with a correlation coefficient (R) of 0.296 and weighted average of 20.7%, a difference of 26.1%.
Female Poverty Among 18-24 Year Olds Correlation Summary
| Measurement | Immigrants from India | Immigrants from Liberia |
| Minimum | 1.9% | 4.0% |
| Maximum | 37.7% | 70.3% |
| Range | 35.8% | 66.3% |
| Mean | 13.3% | 20.5% |
| Median | 12.3% | 18.5% |
| Interquartile 25% (IQ1) | 8.6% | 12.7% |
| Interquartile 75% (IQ3) | 17.5% | 23.2% |
| Interquartile Range (IQR) | 8.8% | 10.5% |
| Standard Deviation (Sample) | 6.7% | 12.3% |
| Standard Deviation (Population) | 6.7% | 12.2% |
Similar Demographics by Female Poverty Among 18-24 Year Olds
Demographics Similar to Immigrants from India by Female Poverty Among 18-24 Year Olds
In terms of female poverty among 18-24 year olds, the demographic groups most similar to Immigrants from India are Immigrants from Cuba (16.4%, a difference of 0.030%), Immigrants from Portugal (16.5%, a difference of 0.72%), Immigrants from Philippines (16.7%, a difference of 1.5%), Immigrants from the Azores (16.7%, a difference of 1.5%), and Chinese (16.2%, a difference of 1.7%).
| Demographics | Rating | Rank | Female Poverty Among 18-24 Year Olds |
| Assyrians/Chaldeans/Syriacs | 100.0 /100 | #1 | Exceptional 13.7% |
| Chinese | 100.0 /100 | #2 | Exceptional 16.2% |
| Immigrants | Cuba | 100.0 /100 | #3 | Exceptional 16.4% |
| Immigrants | India | 100.0 /100 | #4 | Exceptional 16.4% |
| Immigrants | Portugal | 100.0 /100 | #5 | Exceptional 16.5% |
| Immigrants | Philippines | 100.0 /100 | #6 | Exceptional 16.7% |
| Immigrants | Azores | 100.0 /100 | #7 | Exceptional 16.7% |
| Immigrants | Bolivia | 100.0 /100 | #8 | Exceptional 16.7% |
| Immigrants | Peru | 100.0 /100 | #9 | Exceptional 16.9% |
| Koreans | 100.0 /100 | #10 | Exceptional 16.9% |
| Thais | 100.0 /100 | #11 | Exceptional 17.0% |
| Immigrants | Pakistan | 100.0 /100 | #12 | Exceptional 17.0% |
| Immigrants | Poland | 100.0 /100 | #13 | Exceptional 17.1% |
| Tongans | 100.0 /100 | #14 | Exceptional 17.1% |
| Cubans | 100.0 /100 | #15 | Exceptional 17.2% |
Demographics Similar to Immigrants from Liberia by Female Poverty Among 18-24 Year Olds
In terms of female poverty among 18-24 year olds, the demographic groups most similar to Immigrants from Liberia are French (20.7%, a difference of 0.040%), Norwegian (20.7%, a difference of 0.060%), Guatemalan (20.7%, a difference of 0.070%), Estonian (20.7%, a difference of 0.080%), and Immigrants from Sweden (20.7%, a difference of 0.15%).
| Demographics | Rating | Rank | Female Poverty Among 18-24 Year Olds |
| Immigrants | Laos | 9.7 /100 | #217 | Tragic 20.6% |
| Immigrants | Nepal | 9.6 /100 | #218 | Tragic 20.7% |
| Immigrants | Micronesia | 9.6 /100 | #219 | Tragic 20.7% |
| British | 9.4 /100 | #220 | Tragic 20.7% |
| Barbadians | 9.0 /100 | #221 | Tragic 20.7% |
| Guatemalans | 8.1 /100 | #222 | Tragic 20.7% |
| French | 7.9 /100 | #223 | Tragic 20.7% |
| Immigrants | Liberia | 7.6 /100 | #224 | Tragic 20.7% |
| Norwegians | 7.3 /100 | #225 | Tragic 20.7% |
| Estonians | 7.2 /100 | #226 | Tragic 20.7% |
| Immigrants | Sweden | 6.8 /100 | #227 | Tragic 20.7% |
| Ghanaians | 6.5 /100 | #228 | Tragic 20.8% |
| Australians | 6.1 /100 | #229 | Tragic 20.8% |
| Whites/Caucasians | 6.1 /100 | #230 | Tragic 20.8% |
| Immigrants | St. Vincent and the Grenadines | 6.0 /100 | #231 | Tragic 20.8% |