Ute vs Immigrants from France Receiving Food Stamps
COMPARE
Ute
Immigrants from France
Receiving Food Stamps
Receiving Food Stamps Comparison
Ute
Immigrants from France
14.7%
RECEIVING FOOD STAMPS
0.1/ 100
METRIC RATING
275th/ 347
METRIC RANK
10.1%
RECEIVING FOOD STAMPS
98.3/ 100
METRIC RATING
89th/ 347
METRIC RANK
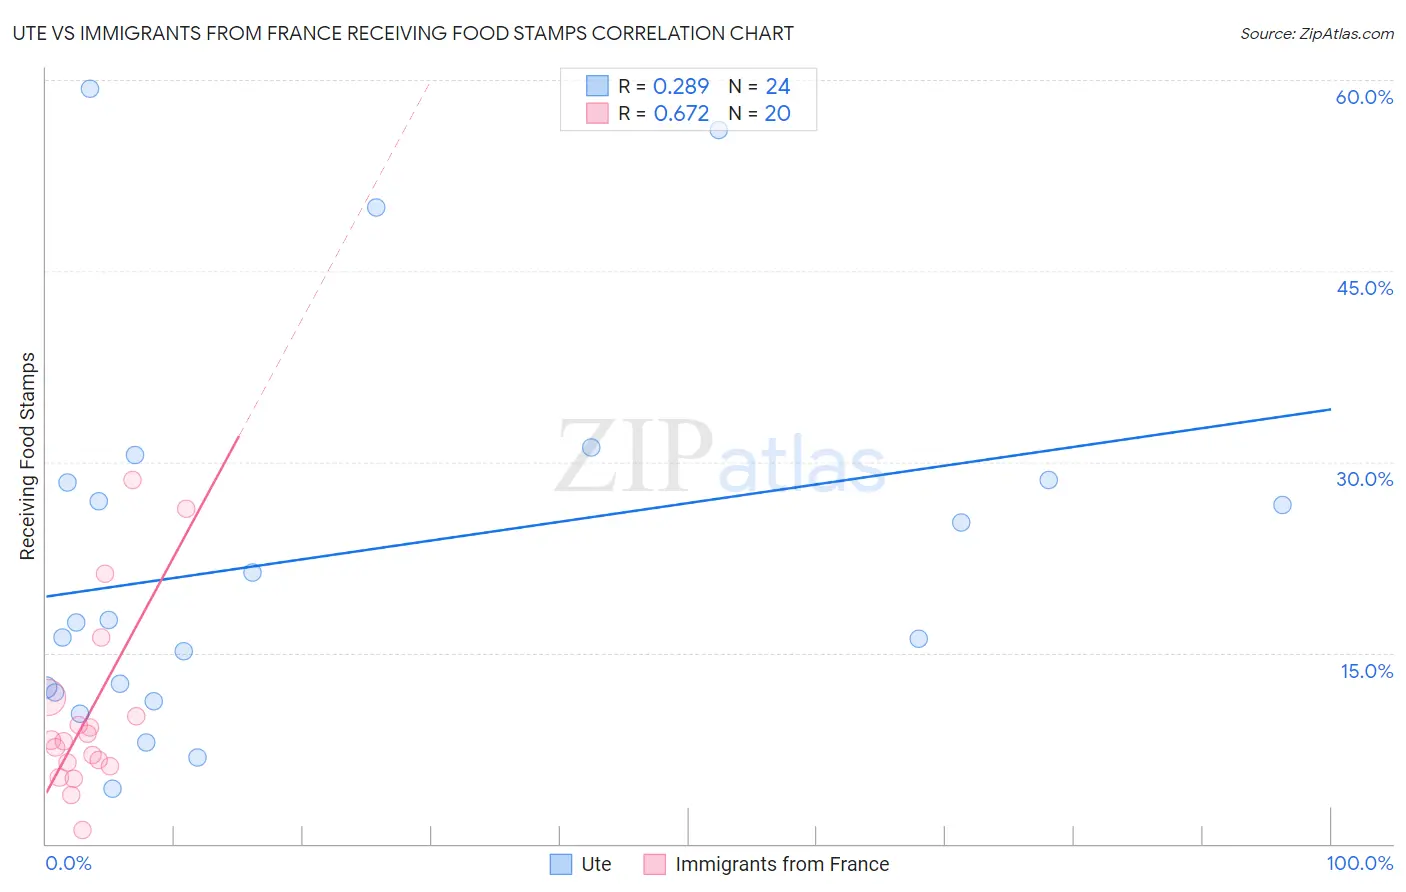
Ute vs Immigrants from France Receiving Food Stamps Correlation Chart
The statistical analysis conducted on geographies consisting of 55,636,581 people shows a weak positive correlation between the proportion of Ute and percentage of population receiving government assistance and/or food stamps in the United States with a correlation coefficient (R) of 0.289 and weighted average of 14.7%. Similarly, the statistical analysis conducted on geographies consisting of 287,189,071 people shows a significant positive correlation between the proportion of Immigrants from France and percentage of population receiving government assistance and/or food stamps in the United States with a correlation coefficient (R) of 0.672 and weighted average of 10.1%, a difference of 45.9%.
Receiving Food Stamps Correlation Summary
| Measurement | Ute | Immigrants from France |
| Minimum | 4.3% | 1.1% |
| Maximum | 59.3% | 28.6% |
| Range | 55.0% | 27.5% |
| Mean | 22.6% | 10.3% |
| Median | 17.4% | 8.1% |
| Interquartile 25% (IQ1) | 12.1% | 6.2% |
| Interquartile 75% (IQ3) | 28.5% | 10.8% |
| Interquartile Range (IQR) | 16.4% | 4.5% |
| Standard Deviation (Sample) | 14.8% | 7.3% |
| Standard Deviation (Population) | 14.5% | 7.1% |
Similar Demographics by Receiving Food Stamps
Demographics Similar to Ute by Receiving Food Stamps
In terms of receiving food stamps, the demographic groups most similar to Ute are Immigrants from Western Africa (14.7%, a difference of 0.080%), Alaskan Athabascan (14.7%, a difference of 0.10%), Chippewa (14.7%, a difference of 0.13%), Immigrants from Guatemala (14.6%, a difference of 0.35%), and Mexican (14.6%, a difference of 0.44%).
| Demographics | Rating | Rank | Receiving Food Stamps |
| Guatemalans | 0.1 /100 | #268 | Tragic 14.4% |
| Nepalese | 0.1 /100 | #269 | Tragic 14.6% |
| Mexicans | 0.1 /100 | #270 | Tragic 14.6% |
| Immigrants | Guatemala | 0.1 /100 | #271 | Tragic 14.6% |
| Chippewa | 0.1 /100 | #272 | Tragic 14.7% |
| Alaskan Athabascans | 0.1 /100 | #273 | Tragic 14.7% |
| Immigrants | Western Africa | 0.1 /100 | #274 | Tragic 14.7% |
| Ute | 0.1 /100 | #275 | Tragic 14.7% |
| Liberians | 0.1 /100 | #276 | Tragic 14.8% |
| Seminole | 0.1 /100 | #277 | Tragic 14.8% |
| Belizeans | 0.1 /100 | #278 | Tragic 14.8% |
| Kiowa | 0.0 /100 | #279 | Tragic 14.9% |
| Ecuadorians | 0.0 /100 | #280 | Tragic 14.9% |
| Spanish American Indians | 0.0 /100 | #281 | Tragic 14.9% |
| Immigrants | Central America | 0.0 /100 | #282 | Tragic 15.0% |
Demographics Similar to Immigrants from France by Receiving Food Stamps
In terms of receiving food stamps, the demographic groups most similar to Immigrants from France are Immigrants from Kuwait (10.0%, a difference of 0.25%), Egyptian (10.0%, a difference of 0.31%), Immigrants from Norway (10.0%, a difference of 0.34%), Immigrants from Romania (10.0%, a difference of 0.44%), and Immigrants from Israel (10.0%, a difference of 0.62%).
| Demographics | Rating | Rank | Receiving Food Stamps |
| Austrians | 98.6 /100 | #82 | Exceptional 10.0% |
| Dutch | 98.6 /100 | #83 | Exceptional 10.0% |
| Immigrants | Israel | 98.5 /100 | #84 | Exceptional 10.0% |
| Immigrants | Romania | 98.5 /100 | #85 | Exceptional 10.0% |
| Immigrants | Norway | 98.4 /100 | #86 | Exceptional 10.0% |
| Egyptians | 98.4 /100 | #87 | Exceptional 10.0% |
| Immigrants | Kuwait | 98.4 /100 | #88 | Exceptional 10.0% |
| Immigrants | France | 98.3 /100 | #89 | Exceptional 10.1% |
| Finns | 97.9 /100 | #90 | Exceptional 10.2% |
| Jordanians | 97.9 /100 | #91 | Exceptional 10.2% |
| Irish | 97.9 /100 | #92 | Exceptional 10.2% |
| Belgians | 97.7 /100 | #93 | Exceptional 10.2% |
| Immigrants | Greece | 97.4 /100 | #94 | Exceptional 10.3% |
| Basques | 97.4 /100 | #95 | Exceptional 10.3% |
| Welsh | 97.3 /100 | #96 | Exceptional 10.3% |