Immigrants from Australia vs Immigrants from Saudi Arabia Seniors Poverty Over the Age of 65
COMPARE
Immigrants from Australia
Immigrants from Saudi Arabia
Seniors Poverty Over the Age of 65
Seniors Poverty Over the Age of 65 Comparison
Immigrants from Australia
Immigrants from Saudi Arabia
10.5%
SENIORS POVERTY OVER THE AGE OF 65
85.1/ 100
METRIC RATING
137th/ 347
METRIC RANK
10.7%
SENIORS POVERTY OVER THE AGE OF 65
74.9/ 100
METRIC RATING
154th/ 347
METRIC RANK
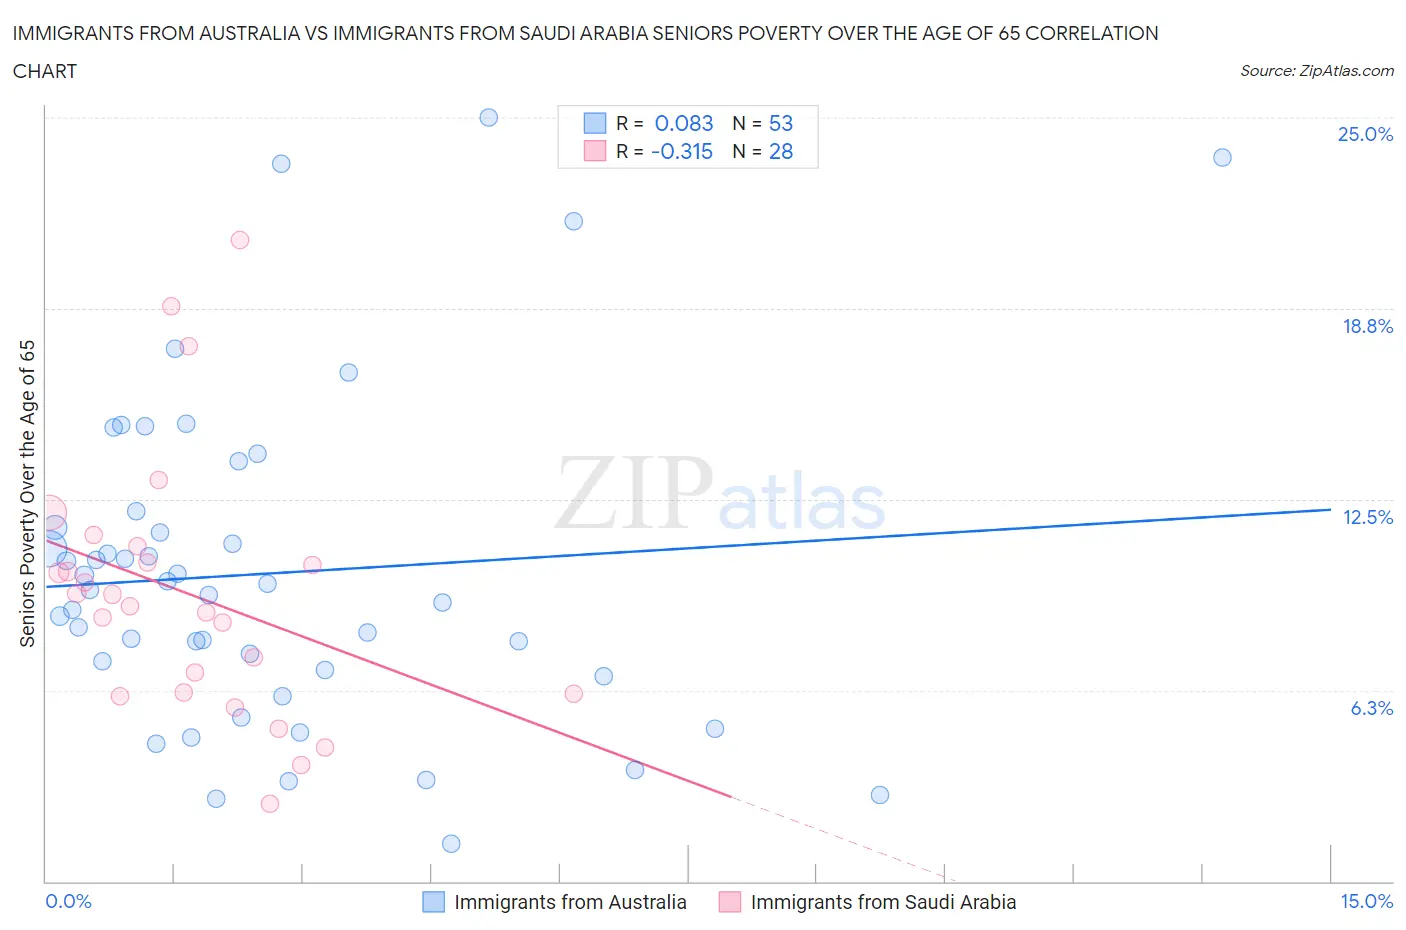
Immigrants from Australia vs Immigrants from Saudi Arabia Seniors Poverty Over the Age of 65 Correlation Chart
The statistical analysis conducted on geographies consisting of 226,798,964 people shows a slight positive correlation between the proportion of Immigrants from Australia and poverty level among seniors over the age of 65 in the United States with a correlation coefficient (R) of 0.083 and weighted average of 10.5%. Similarly, the statistical analysis conducted on geographies consisting of 164,031,623 people shows a mild negative correlation between the proportion of Immigrants from Saudi Arabia and poverty level among seniors over the age of 65 in the United States with a correlation coefficient (R) of -0.315 and weighted average of 10.7%, a difference of 1.5%.
Seniors Poverty Over the Age of 65 Correlation Summary
| Measurement | Immigrants from Australia | Immigrants from Saudi Arabia |
| Minimum | 1.2% | 2.5% |
| Maximum | 25.0% | 21.0% |
| Range | 23.8% | 18.5% |
| Mean | 10.1% | 9.4% |
| Median | 9.5% | 9.2% |
| Interquartile 25% (IQ1) | 6.8% | 6.2% |
| Interquartile 75% (IQ3) | 11.9% | 10.7% |
| Interquartile Range (IQR) | 5.0% | 4.6% |
| Standard Deviation (Sample) | 5.4% | 4.3% |
| Standard Deviation (Population) | 5.3% | 4.2% |
Demographics Similar to Immigrants from Australia and Immigrants from Saudi Arabia by Seniors Poverty Over the Age of 65
In terms of seniors poverty over the age of 65, the demographic groups most similar to Immigrants from Australia are Immigrants from Latvia (10.5%, a difference of 0.060%), Portuguese (10.5%, a difference of 0.16%), Immigrants from Serbia (10.5%, a difference of 0.26%), Immigrants from Norway (10.5%, a difference of 0.27%), and Immigrants from Kenya (10.5%, a difference of 0.29%). Similarly, the demographic groups most similar to Immigrants from Saudi Arabia are Fijian (10.7%, a difference of 0.080%), Chickasaw (10.7%, a difference of 0.16%), Immigrants from Egypt (10.6%, a difference of 0.19%), Spanish (10.6%, a difference of 0.23%), and Immigrants from Switzerland (10.6%, a difference of 0.30%).
| Demographics | Rating | Rank | Seniors Poverty Over the Age of 65 |
| Immigrants | Norway | 86.5 /100 | #135 | Excellent 10.5% |
| Immigrants | Serbia | 86.4 /100 | #136 | Excellent 10.5% |
| Immigrants | Australia | 85.1 /100 | #137 | Excellent 10.5% |
| Immigrants | Latvia | 84.7 /100 | #138 | Excellent 10.5% |
| Portuguese | 84.1 /100 | #139 | Excellent 10.5% |
| Immigrants | Kenya | 83.4 /100 | #140 | Excellent 10.5% |
| Immigrants | Europe | 83.3 /100 | #141 | Excellent 10.5% |
| Osage | 82.8 /100 | #142 | Excellent 10.6% |
| Immigrants | Asia | 80.8 /100 | #143 | Excellent 10.6% |
| Iraqis | 80.7 /100 | #144 | Excellent 10.6% |
| Laotians | 79.9 /100 | #145 | Good 10.6% |
| Alaskan Athabascans | 79.1 /100 | #146 | Good 10.6% |
| Immigrants | Greece | 79.0 /100 | #147 | Good 10.6% |
| Americans | 78.1 /100 | #148 | Good 10.6% |
| Immigrants | Cameroon | 78.1 /100 | #149 | Good 10.6% |
| Immigrants | Switzerland | 77.3 /100 | #150 | Good 10.6% |
| Spanish | 76.8 /100 | #151 | Good 10.6% |
| Immigrants | Egypt | 76.5 /100 | #152 | Good 10.6% |
| Fijians | 75.6 /100 | #153 | Good 10.7% |
| Immigrants | Saudi Arabia | 74.9 /100 | #154 | Good 10.7% |
| Chickasaw | 73.6 /100 | #155 | Good 10.7% |