Icelander vs Immigrants from North Macedonia Child Poverty Among Boys Under 16

COMPARE

Icelander
Race
Ancestry
AfghanAfricanAlaska NativeAlaskan AthabascanAlbanianAleutAlsatianAmericanApacheArabArapahoArgentineanArmenianAssyrian/Chaldean/SyriacAustralianAustrianBahamianBangladeshiBarbadianBasqueBelgianBelizeanBermudanBhutaneseBlackfeetBolivianBrazilianBritishBritish West IndianBulgarianBurmeseCajunCambodianCanadianCape VerdeanCarpatho RusynCelticCentral AmericanCentral American IndianCherokeeCheyenneChickasawChileanChineseChippewaChoctawColombianColvilleComancheCosta RicanCreeCreekCroatianCrowCubanCypriotCzechCzechoslovakianDanishDelawareDominicanDutchDutch West IndianEastern EuropeanEcuadorianEgyptianEnglishEstonianEthiopianEuropeanFijianFilipinoFinnishFrenchFrench American IndianFrench CanadianGermanGerman RussianGhanaianGreekGuamanian/ChamorroGuatemalanGuyaneseHaitianHmongHonduranHopiHoumaHungarianIcelanderIndian (Asian)IndonesianInupiatIranianIraqiIrishIroquoisIsraeliItalianJamaicanJapaneseJordanianKenyanKiowaKoreanLaotianLatvianLebaneseLiberianLithuanianLumbeeLuxembourgerMacedonianMalaysianMalteseMarshalleseMenomineeMexicanMexican American IndianMongolianMoroccanNative HawaiianNavajoNepaleseNew ZealanderNicaraguanNigerianNorthern EuropeanNorwegianOkinawanOsageOttawaPaiutePakistaniPalestinianPanamanianParaguayanPennsylvania GermanPeruvianPimaPolishPortuguesePotawatomiPuebloPuerto RicanPuget Sound SalishRomanianRussianSalvadoranSamoanScandinavianScotch-IrishScottishSeminoleSenegaleseSerbianShoshoneSierra LeoneanSiouxSlavicSlovakSloveneSomaliSouth AfricanSouth AmericanSouth American IndianSoviet UnionSpaniardSpanishSpanish AmericanSpanish American IndianSri LankanSubsaharan AfricanSudaneseSwedishSwissSyrianTaiwaneseThaiTlingit-HaidaTohono O'OdhamTonganTrinidadian and TobagonianTsimshianTurkishU.S. Virgin IslanderUgandanUkrainianUruguayanUteVenezuelanVietnameseWelshWest IndianYakamaYaquiYugoslavianYumanYup'ikZimbabwean
Immigration
NonimmigrantsImmigrantsAfghanistanAfricaAlbaniaArgentinaArmeniaAsiaAustraliaAustriaBahamasBangladeshBarbadosBelarusBelgiumBelizeBoliviaBosnia and HerzegovinaBrazilBulgariaBurma/MyanmarCabo VerdeCambodiaCameroonCanadaCaribbeanCentral AmericaChileChinaColombiaCongoCosta RicaCroatiaCubaCzechoslovakiaDenmarkDominicaDominican RepublicEastern AfricaEastern AsiaEastern EuropeEcuadorEgyptEl SalvadorEnglandEritreaEthiopiaEuropeFijiFranceGermanyGhanaGreeceGrenadaGuatemalaGuyanaHaitiHondurasHong KongHungaryIndiaIndonesiaIranIraqIrelandIsraelItalyJamaicaJapanJordanKazakhstanKenyaKoreaKuwaitLaosLatin AmericaLatviaLebanonLiberiaLithuaniaMalaysiaMexicoMicronesiaMiddle AfricaMoldovaMoroccoNepalNetherlandsNicaraguaNigeriaNorth AmericaNorthern AfricaNorthern EuropeNorwayOceaniaPakistanPanamaPeruPhilippinesPolandPortugalRomaniaRussiaSaudi ArabiaScotlandSenegalSerbiaSierra LeoneSingaporeSomaliaSouth AfricaSouth AmericaSouth Central AsiaSouth Eastern AsiaSouthern EuropeSpainSri LankaSt. Vincent and the GrenadinesSudanSwedenSwitzerlandSyriaTaiwanThailandTrinidad and TobagoTurkeyUgandaUkraineUruguayUzbekistanVenezuelaVietnamWest IndiesWestern AfricaWestern AsiaWestern EuropeYemenZaireZimbabweAzores
Immigrants from North Macedonia
Race
Ancestry
AfghanAfricanAlaska NativeAlaskan AthabascanAlbanianAleutAlsatianAmericanApacheArabArapahoArgentineanArmenianAssyrian/Chaldean/SyriacAustralianAustrianBahamianBangladeshiBarbadianBasqueBelgianBelizeanBermudanBhutaneseBlackfeetBolivianBrazilianBritishBritish West IndianBulgarianBurmeseCajunCambodianCanadianCape VerdeanCarpatho RusynCelticCentral AmericanCentral American IndianCherokeeCheyenneChickasawChileanChineseChippewaChoctawColombianColvilleComancheCosta RicanCreeCreekCroatianCrowCubanCypriotCzechCzechoslovakianDanishDelawareDominicanDutchDutch West IndianEastern EuropeanEcuadorianEgyptianEnglishEstonianEthiopianEuropeanFijianFilipinoFinnishFrenchFrench American IndianFrench CanadianGermanGerman RussianGhanaianGreekGuamanian/ChamorroGuatemalanGuyaneseHaitianHmongHonduranHopiHoumaHungarianIndian (Asian)IndonesianInupiatIranianIraqiIrishIroquoisIsraeliItalianJamaicanJapaneseJordanianKenyanKiowaKoreanLaotianLatvianLebaneseLiberianLithuanianLumbeeLuxembourgerMacedonianMalaysianMalteseMarshalleseMenomineeMexicanMexican American IndianMongolianMoroccanNative HawaiianNavajoNepaleseNew ZealanderNicaraguanNigerianNorthern EuropeanNorwegianOkinawanOsageOttawaPaiutePakistaniPalestinianPanamanianParaguayanPennsylvania GermanPeruvianPimaPolishPortuguesePotawatomiPuebloPuerto RicanPuget Sound SalishRomanianRussianSalvadoranSamoanScandinavianScotch-IrishScottishSeminoleSenegaleseSerbianShoshoneSierra LeoneanSiouxSlavicSlovakSloveneSomaliSouth AfricanSouth AmericanSouth American IndianSoviet UnionSpaniardSpanishSpanish AmericanSpanish American IndianSri LankanSubsaharan AfricanSudaneseSwedishSwissSyrianTaiwaneseThaiTlingit-HaidaTohono O'OdhamTonganTrinidadian and TobagonianTsimshianTurkishU.S. Virgin IslanderUgandanUkrainianUruguayanUteVenezuelanVietnameseWelshWest IndianYakamaYaquiYugoslavianYumanYup'ikZimbabwean
Immigration
NonimmigrantsImmigrantsAfghanistanAfricaAlbaniaArgentinaArmeniaAsiaAustraliaAustriaBahamasBangladeshBarbadosBelarusBelgiumBelizeBoliviaBosnia and HerzegovinaBrazilBulgariaBurma/MyanmarCabo VerdeCambodiaCameroonCanadaCaribbeanCentral AmericaChileChinaColombiaCongoCosta RicaCroatiaCubaCzechoslovakiaDenmarkDominicaDominican RepublicEastern AfricaEastern AsiaEastern EuropeEcuadorEgyptEl SalvadorEnglandEritreaEthiopiaEuropeFijiFranceGermanyGhanaGreeceGrenadaGuatemalaGuyanaHaitiHondurasHong KongHungaryIndiaIndonesiaIranIraqIrelandIsraelItalyJamaicaJapanJordanKazakhstanKenyaKoreaKuwaitLaosLatin AmericaLatviaLebanonLiberiaLithuaniaMalaysiaMexicoMicronesiaMiddle AfricaMoldovaMoroccoNepalNetherlandsNicaraguaNigeriaNorth AmericaNorth MacedoniaNorthern AfricaNorthern EuropeNorwayOceaniaPakistanPanamaPeruPhilippinesPolandPortugalRomaniaRussiaSaudi ArabiaScotlandSenegalSerbiaSierra LeoneSingaporeSomaliaSouth AfricaSouth AmericaSouth Central AsiaSouth Eastern AsiaSouthern EuropeSpainSri LankaSt. Vincent and the GrenadinesSudanSwedenSwitzerlandSyriaTaiwanThailandTrinidad and TobagoTurkeyUgandaUkraineUruguayUzbekistanVenezuelaVietnamWest IndiesWestern AfricaWestern AsiaWestern EuropeYemenZaireZimbabweAzores
Child Poverty Among Boys Under 16
Income
Poverty
Unemployment
Labor Participation
Family Structure
Vehicle Availability
Education Level
Disability

Child Poverty Among Boys Under 16 Comparison

Icelanders

Immigrants from North Macedonia

Excellent
Exceptional
15.5%
CHILD POVERTY AMONG BOYS UNDER 16
87.5/ 100
METRIC RATING
136th/ 347
METRIC RANK
14.9%
CHILD POVERTY AMONG BOYS UNDER 16
96.3/ 100
METRIC RATING
96th/ 347
METRIC RANK

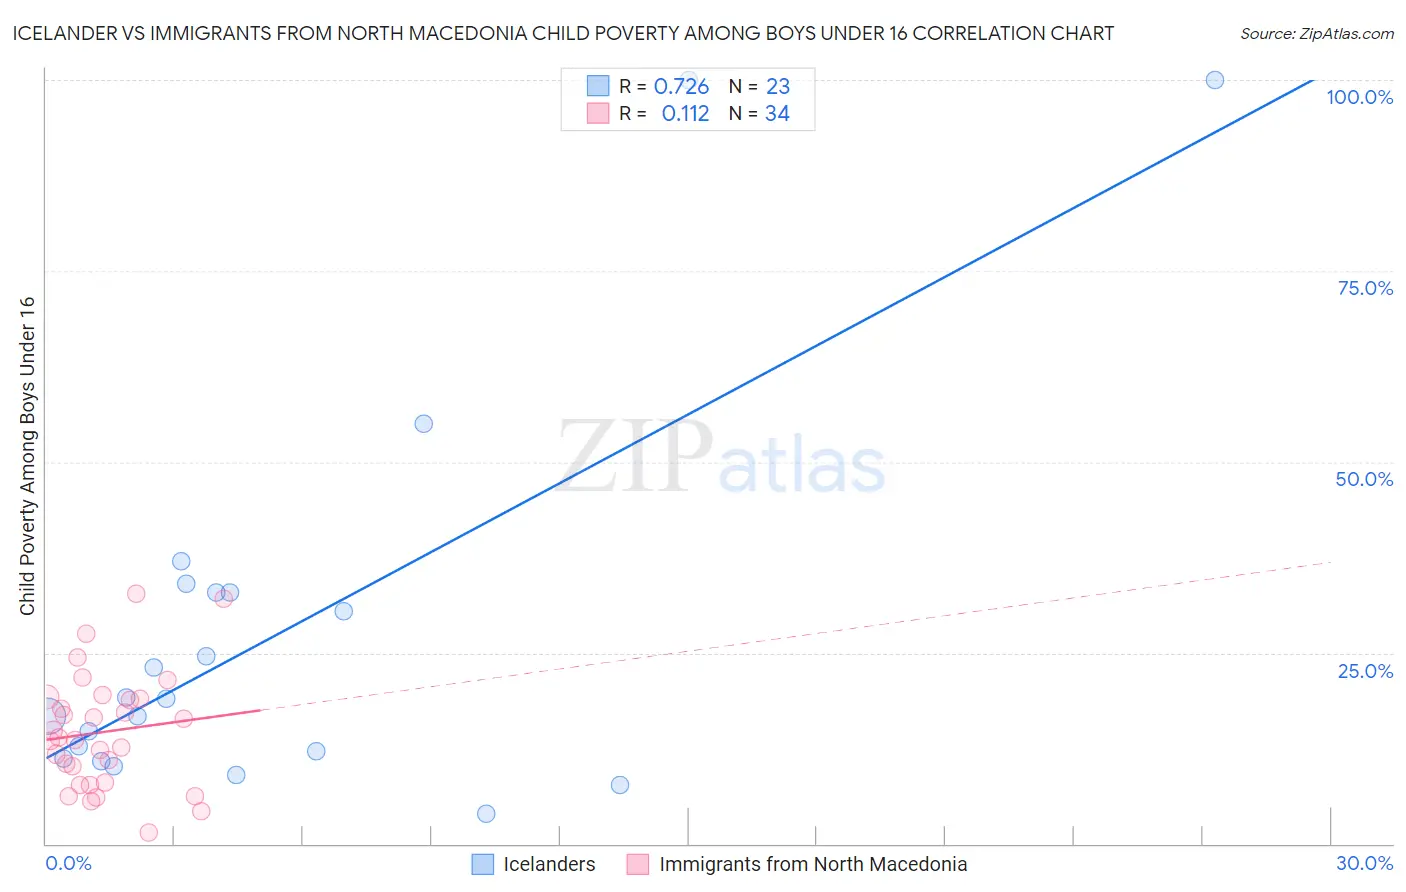
Icelander vs Immigrants from North Macedonia Child Poverty Among Boys Under 16 Correlation Chart

The statistical analysis conducted on geographies consisting of 158,023,783 people shows a strong positive correlation between the proportion of Icelanders and poverty level among boys under the age of 16 in the United States with a correlation coefficient (R) of 0.726 and weighted average of 15.5%. Similarly, the statistical analysis conducted on geographies consisting of 73,631,017 people shows a poor positive correlation between the proportion of Immigrants from North Macedonia and poverty level among boys under the age of 16 in the United States with a correlation coefficient (R) of 0.112 and weighted average of 14.9%, a difference of 4.0%.
Icelander vs Immigrants from North Macedonia Child Poverty Among Boys Under 16

Child Poverty Among Boys Under 16 Correlation Summary

MeasurementIcelanderImmigrants from North Macedonia
Minimum3.9%1.4%
Maximum100.0%32.7%
Range96.1%31.2%
Mean27.6%14.7%
Median18.9%13.7%
Interquartile 25% (IQ1)11.2%8.1%
Interquartile 75% (IQ3)33.0%19.1%
Interquartile Range (IQR)21.8%11.0%
Standard Deviation (Sample)25.8%7.6%
Standard Deviation (Population)25.2%7.4%

Similar Demographics by Child Poverty Among Boys Under 16

Demographics Similar to Icelanders by Child Poverty Among Boys Under 16

In terms of child poverty among boys under 16, the demographic groups most similar to Icelanders are Portuguese (15.5%, a difference of 0.010%), Immigrants from Spain (15.6%, a difference of 0.10%), Peruvian (15.5%, a difference of 0.19%), Welsh (15.5%, a difference of 0.23%), and Immigrants from Southern Europe (15.6%, a difference of 0.25%).
DemographicsRating | RankChild Poverty Among Boys Under 16
Immigrants | Brazil
90.3
/100
|
#129
Exceptional
15.4%
Mongolians
90.2
/100
|
#130
Exceptional
15.4%
Immigrants | Western Europe
90.0
/100
|
#131
Exceptional
15.4%
Immigrants | Kazakhstan
88.7
/100
|
#132
Excellent
15.5%
Welsh
88.3
/100
|
#133
Excellent
15.5%
Peruvians
88.1
/100
|
#134
Excellent
15.5%
Portuguese
87.5
/100
|
#135
Excellent
15.5%
Icelanders
87.5
/100
|
#136
Excellent
15.5%
Immigrants | Spain
87.1
/100
|
#137
Excellent
15.6%
Immigrants | Southern Europe
86.5
/100
|
#138
Excellent
15.6%
Albanians
86.5
/100
|
#139
Excellent
15.6%
Immigrants | Kuwait
85.6
/100
|
#140
Excellent
15.6%
Slavs
84.5
/100
|
#141
Excellent
15.7%
Immigrants | Hungary
84.1
/100
|
#142
Excellent
15.7%
Immigrants | Fiji
83.6
/100
|
#143
Excellent
15.7%

Demographics Similar to Immigrants from North Macedonia by Child Poverty Among Boys Under 16

In terms of child poverty among boys under 16, the demographic groups most similar to Immigrants from North Macedonia are Immigrants from Egypt (14.9%, a difference of 0.010%), British (15.0%, a difference of 0.050%), Immigrants from France (15.0%, a difference of 0.15%), Finnish (14.9%, a difference of 0.25%), and Sri Lankan (14.9%, a difference of 0.36%).
DemographicsRating | RankChild Poverty Among Boys Under 16
Immigrants | Argentina
97.1
/100
|
#89
Exceptional
14.8%
Austrians
97.1
/100
|
#90
Exceptional
14.8%
Paraguayans
96.8
/100
|
#91
Exceptional
14.9%
Argentineans
96.7
/100
|
#92
Exceptional
14.9%
Sri Lankans
96.7
/100
|
#93
Exceptional
14.9%
Immigrants | Italy
96.7
/100
|
#94
Exceptional
14.9%
Finns
96.5
/100
|
#95
Exceptional
14.9%
Immigrants | North Macedonia
96.3
/100
|
#96
Exceptional
14.9%
Immigrants | Egypt
96.2
/100
|
#97
Exceptional
14.9%
British
96.2
/100
|
#98
Exceptional
15.0%
Immigrants | France
96.1
/100
|
#99
Exceptional
15.0%
Chileans
95.8
/100
|
#100
Exceptional
15.0%
Immigrants | Belarus
95.7
/100
|
#101
Exceptional
15.0%
Romanians
95.6
/100
|
#102
Exceptional
15.0%
Immigrants | Denmark
95.6
/100
|
#103
Exceptional
15.0%