Houma vs Yakama Child Poverty Among Girls Under 16
COMPARE
Houma
Yakama
Child Poverty Among Girls Under 16
Child Poverty Among Girls Under 16 Comparison
Houma
Yakama
21.5%
CHILD POVERTY AMONG GIRLS UNDER 16
0.0/ 100
METRIC RATING
308th/ 347
METRIC RANK
22.6%
CHILD POVERTY AMONG GIRLS UNDER 16
0.0/ 100
METRIC RATING
322nd/ 347
METRIC RANK
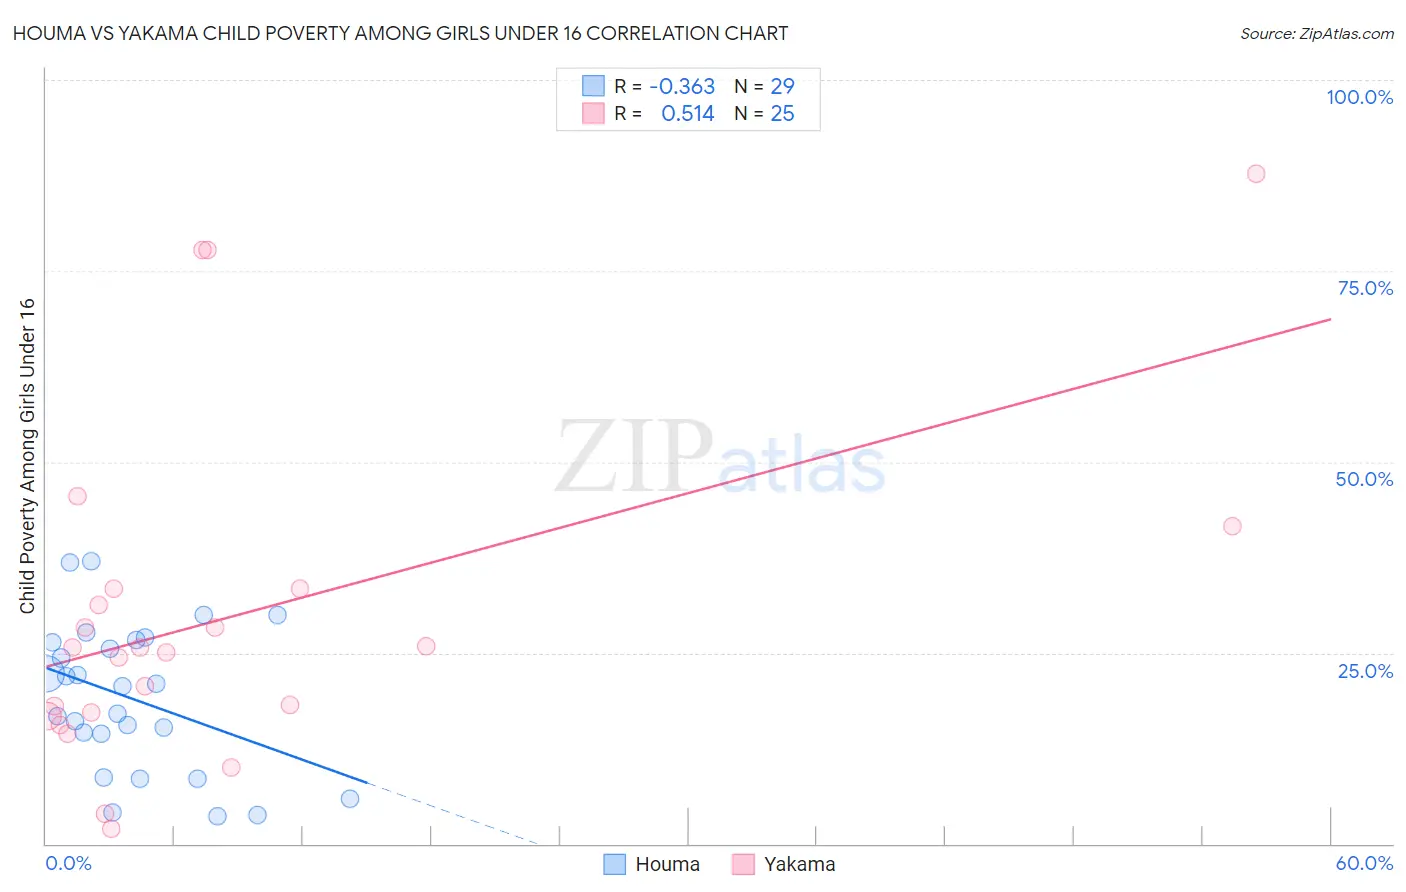
Houma vs Yakama Child Poverty Among Girls Under 16 Correlation Chart
The statistical analysis conducted on geographies consisting of 36,699,840 people shows a mild negative correlation between the proportion of Houma and poverty level among girls under the age of 16 in the United States with a correlation coefficient (R) of -0.363 and weighted average of 21.5%. Similarly, the statistical analysis conducted on geographies consisting of 19,841,501 people shows a substantial positive correlation between the proportion of Yakama and poverty level among girls under the age of 16 in the United States with a correlation coefficient (R) of 0.514 and weighted average of 22.6%, a difference of 5.1%.
Child Poverty Among Girls Under 16 Correlation Summary
| Measurement | Houma | Yakama |
| Minimum | 3.6% | 2.0% |
| Maximum | 37.1% | 87.7% |
| Range | 33.5% | 85.7% |
| Mean | 19.0% | 29.9% |
| Median | 20.6% | 25.6% |
| Interquartile 25% (IQ1) | 11.5% | 17.0% |
| Interquartile 75% (IQ3) | 26.5% | 33.3% |
| Interquartile Range (IQR) | 15.0% | 16.3% |
| Standard Deviation (Sample) | 9.5% | 21.8% |
| Standard Deviation (Population) | 9.3% | 21.4% |
Demographics Similar to Houma and Yakama by Child Poverty Among Girls Under 16
In terms of child poverty among girls under 16, the demographic groups most similar to Houma are Bahamian (21.5%, a difference of 0.12%), Immigrants from Bahamas (21.4%, a difference of 0.18%), Immigrants from Central America (21.4%, a difference of 0.19%), Guatemalan (21.4%, a difference of 0.36%), and Immigrants from Somalia (21.6%, a difference of 0.39%). Similarly, the demographic groups most similar to Yakama are Cajun (22.6%, a difference of 0.020%), Colville (22.5%, a difference of 0.19%), Paiute (22.6%, a difference of 0.31%), Immigrants from Congo (22.7%, a difference of 0.80%), and Honduran (22.2%, a difference of 1.5%).
| Demographics | Rating | Rank | Child Poverty Among Girls Under 16 |
| Guatemalans | 0.0 /100 | #305 | Tragic 21.4% |
| Immigrants | Central America | 0.0 /100 | #306 | Tragic 21.4% |
| Immigrants | Bahamas | 0.0 /100 | #307 | Tragic 21.4% |
| Houma | 0.0 /100 | #308 | Tragic 21.5% |
| Bahamians | 0.0 /100 | #309 | Tragic 21.5% |
| Immigrants | Somalia | 0.0 /100 | #310 | Tragic 21.6% |
| Dutch West Indians | 0.0 /100 | #311 | Tragic 21.6% |
| Immigrants | Mexico | 0.0 /100 | #312 | Tragic 21.6% |
| Creek | 0.0 /100 | #313 | Tragic 21.7% |
| Arapaho | 0.0 /100 | #314 | Tragic 21.7% |
| Ute | 0.0 /100 | #315 | Tragic 21.8% |
| Immigrants | Guatemala | 0.0 /100 | #316 | Tragic 21.9% |
| Africans | 0.0 /100 | #317 | Tragic 21.9% |
| Immigrants | Dominica | 0.0 /100 | #318 | Tragic 22.1% |
| U.S. Virgin Islanders | 0.0 /100 | #319 | Tragic 22.1% |
| Hondurans | 0.0 /100 | #320 | Tragic 22.2% |
| Colville | 0.0 /100 | #321 | Tragic 22.5% |
| Yakama | 0.0 /100 | #322 | Tragic 22.6% |
| Cajuns | 0.0 /100 | #323 | Tragic 22.6% |
| Paiute | 0.0 /100 | #324 | Tragic 22.6% |
| Immigrants | Congo | 0.0 /100 | #325 | Tragic 22.7% |