Houma vs Eastern European Child Poverty Among Boys Under 16
COMPARE
Houma
Eastern European
Child Poverty Among Boys Under 16
Child Poverty Among Boys Under 16 Comparison
Houma
Eastern Europeans
26.2%
CHILD POVERTY AMONG BOYS UNDER 16
0.0/ 100
METRIC RATING
339th/ 347
METRIC RANK
13.5%
CHILD POVERTY AMONG BOYS UNDER 16
99.8/ 100
METRIC RATING
28th/ 347
METRIC RANK
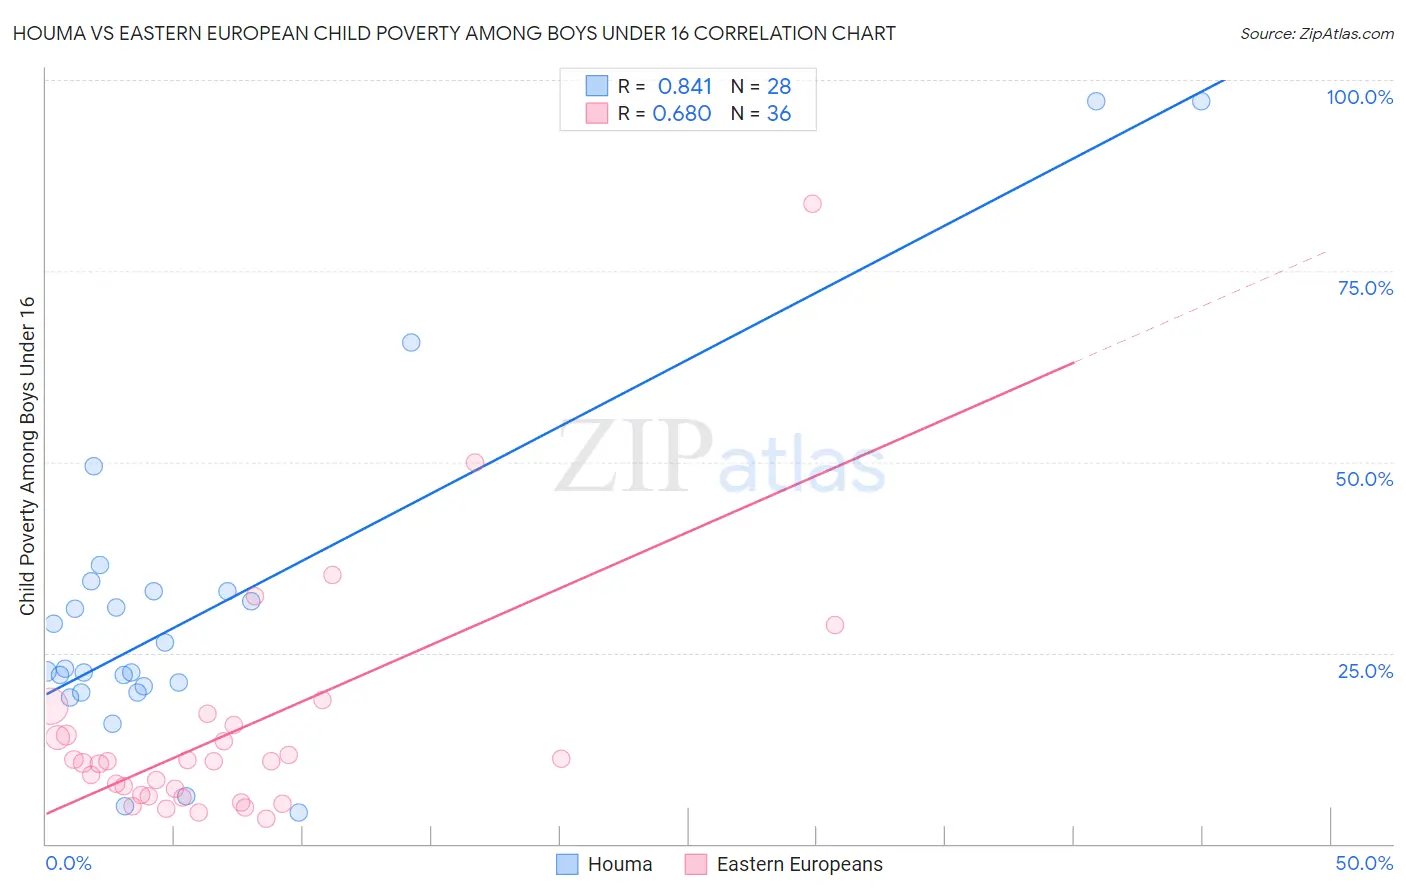
Houma vs Eastern European Child Poverty Among Boys Under 16 Correlation Chart
The statistical analysis conducted on geographies consisting of 36,674,950 people shows a very strong positive correlation between the proportion of Houma and poverty level among boys under the age of 16 in the United States with a correlation coefficient (R) of 0.841 and weighted average of 26.2%. Similarly, the statistical analysis conducted on geographies consisting of 449,246,772 people shows a significant positive correlation between the proportion of Eastern Europeans and poverty level among boys under the age of 16 in the United States with a correlation coefficient (R) of 0.680 and weighted average of 13.5%, a difference of 93.7%.
Child Poverty Among Boys Under 16 Correlation Summary
| Measurement | Houma | Eastern European |
| Minimum | 4.0% | 3.2% |
| Maximum | 97.3% | 83.8% |
| Range | 93.2% | 80.6% |
| Mean | 30.8% | 14.7% |
| Median | 22.8% | 10.8% |
| Interquartile 25% (IQ1) | 20.2% | 6.3% |
| Interquartile 75% (IQ3) | 33.1% | 15.0% |
| Interquartile Range (IQR) | 12.9% | 8.6% |
| Standard Deviation (Sample) | 22.5% | 15.4% |
| Standard Deviation (Population) | 22.1% | 15.2% |
Similar Demographics by Child Poverty Among Boys Under 16
Demographics Similar to Houma by Child Poverty Among Boys Under 16
In terms of child poverty among boys under 16, the demographic groups most similar to Houma are Crow (26.3%, a difference of 0.16%), Hopi (25.9%, a difference of 1.0%), Cheyenne (25.8%, a difference of 1.5%), Sioux (25.3%, a difference of 3.6%), and Yup'ik (24.7%, a difference of 6.0%).
| Demographics | Rating | Rank | Child Poverty Among Boys Under 16 |
| Immigrants | Dominican Republic | 0.0 /100 | #332 | Tragic 24.3% |
| Apache | 0.0 /100 | #333 | Tragic 24.5% |
| Blacks/African Americans | 0.0 /100 | #334 | Tragic 24.5% |
| Yup'ik | 0.0 /100 | #335 | Tragic 24.7% |
| Sioux | 0.0 /100 | #336 | Tragic 25.3% |
| Cheyenne | 0.0 /100 | #337 | Tragic 25.8% |
| Hopi | 0.0 /100 | #338 | Tragic 25.9% |
| Houma | 0.0 /100 | #339 | Tragic 26.2% |
| Crow | 0.0 /100 | #340 | Tragic 26.3% |
| Immigrants | Yemen | 0.0 /100 | #341 | Tragic 28.9% |
| Pima | 0.0 /100 | #342 | Tragic 29.7% |
| Navajo | 0.0 /100 | #343 | Tragic 30.3% |
| Yuman | 0.0 /100 | #344 | Tragic 30.6% |
| Tohono O'odham | 0.0 /100 | #345 | Tragic 31.6% |
| Lumbee | 0.0 /100 | #346 | Tragic 31.9% |
Demographics Similar to Eastern Europeans by Child Poverty Among Boys Under 16
In terms of child poverty among boys under 16, the demographic groups most similar to Eastern Europeans are Asian (13.5%, a difference of 0.060%), Immigrants from Bolivia (13.5%, a difference of 0.15%), Cypriot (13.6%, a difference of 0.19%), Okinawan (13.5%, a difference of 0.23%), and Swedish (13.6%, a difference of 0.28%).
| Demographics | Rating | Rank | Child Poverty Among Boys Under 16 |
| Immigrants | Eastern Asia | 99.9 /100 | #21 | Exceptional 13.3% |
| Tongans | 99.9 /100 | #22 | Exceptional 13.4% |
| Latvians | 99.9 /100 | #23 | Exceptional 13.4% |
| Immigrants | Lithuania | 99.8 /100 | #24 | Exceptional 13.5% |
| Okinawans | 99.8 /100 | #25 | Exceptional 13.5% |
| Immigrants | Bolivia | 99.8 /100 | #26 | Exceptional 13.5% |
| Asians | 99.8 /100 | #27 | Exceptional 13.5% |
| Eastern Europeans | 99.8 /100 | #28 | Exceptional 13.5% |
| Cypriots | 99.8 /100 | #29 | Exceptional 13.6% |
| Swedes | 99.8 /100 | #30 | Exceptional 13.6% |
| Turks | 99.8 /100 | #31 | Exceptional 13.6% |
| Immigrants | China | 99.8 /100 | #32 | Exceptional 13.6% |
| Danes | 99.8 /100 | #33 | Exceptional 13.6% |
| Assyrians/Chaldeans/Syriacs | 99.8 /100 | #34 | Exceptional 13.6% |
| Russians | 99.7 /100 | #35 | Exceptional 13.8% |