Spanish American vs Haitian Female Poverty Among 18-24 Year Olds
COMPARE
Spanish American
Haitian
Female Poverty Among 18-24 Year Olds
Female Poverty Among 18-24 Year Olds Comparison
Spanish Americans
Haitians
21.9%
FEMALE POVERTY AMONG 18-24 YEAR OLDS
0.1/ 100
METRIC RATING
279th/ 347
METRIC RANK
19.0%
FEMALE POVERTY AMONG 18-24 YEAR OLDS
98.9/ 100
METRIC RATING
93rd/ 347
METRIC RANK
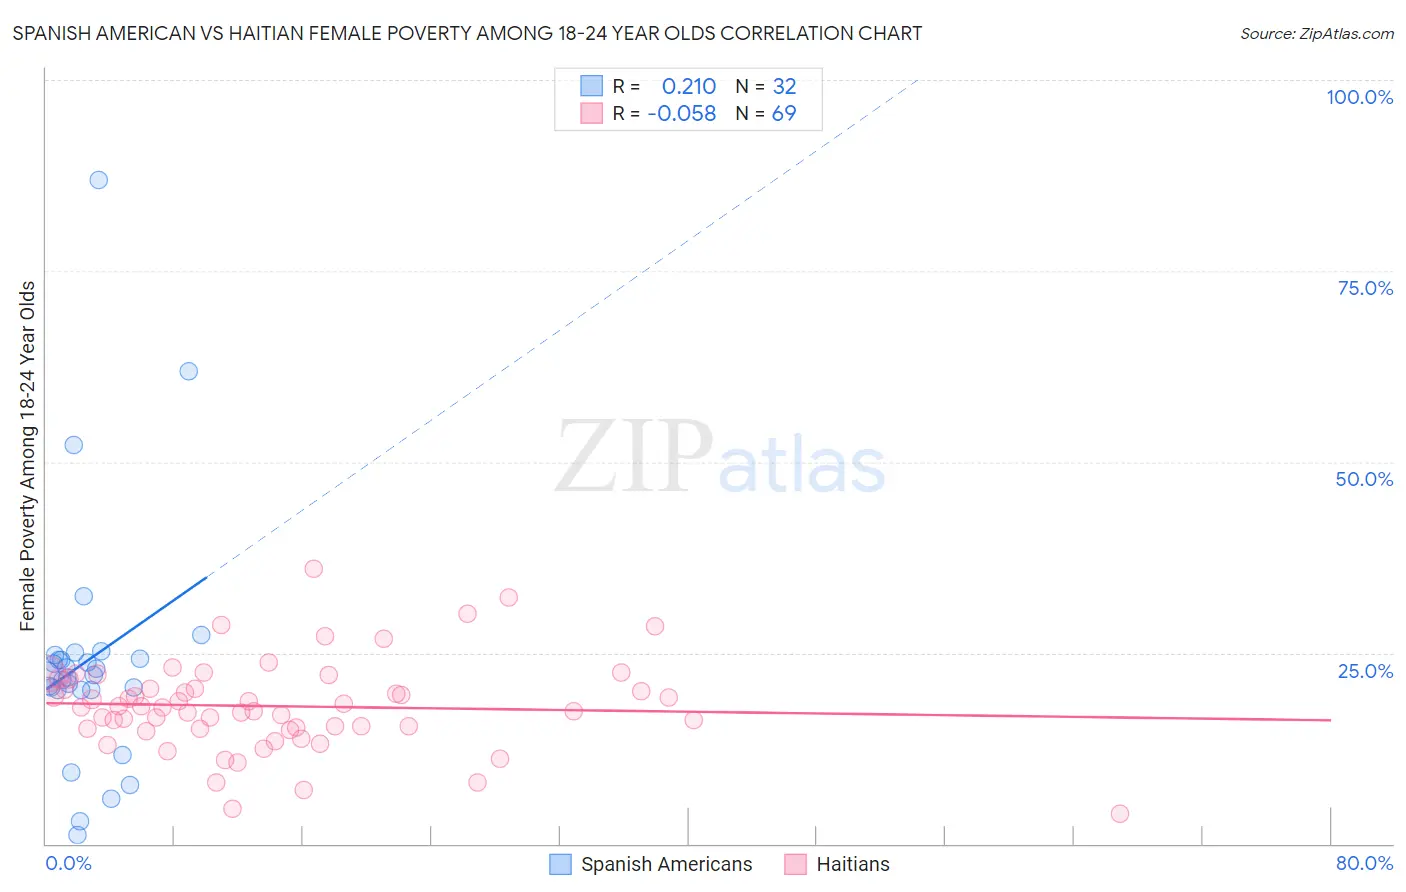
Spanish American vs Haitian Female Poverty Among 18-24 Year Olds Correlation Chart
The statistical analysis conducted on geographies consisting of 102,596,848 people shows a weak positive correlation between the proportion of Spanish Americans and poverty level among females between the ages 18 and 24 in the United States with a correlation coefficient (R) of 0.210 and weighted average of 21.9%. Similarly, the statistical analysis conducted on geographies consisting of 282,712,652 people shows a slight negative correlation between the proportion of Haitians and poverty level among females between the ages 18 and 24 in the United States with a correlation coefficient (R) of -0.058 and weighted average of 19.0%, a difference of 15.3%.
Female Poverty Among 18-24 Year Olds Correlation Summary
| Measurement | Spanish American | Haitian |
| Minimum | 1.1% | 4.0% |
| Maximum | 87.0% | 36.0% |
| Range | 85.8% | 32.0% |
| Mean | 24.1% | 18.0% |
| Median | 22.1% | 17.9% |
| Interquartile 25% (IQ1) | 20.2% | 15.1% |
| Interquartile 75% (IQ3) | 24.5% | 20.9% |
| Interquartile Range (IQR) | 4.3% | 5.8% |
| Standard Deviation (Sample) | 16.4% | 5.9% |
| Standard Deviation (Population) | 16.1% | 5.9% |
Similar Demographics by Female Poverty Among 18-24 Year Olds
Demographics Similar to Spanish Americans by Female Poverty Among 18-24 Year Olds
In terms of female poverty among 18-24 year olds, the demographic groups most similar to Spanish Americans are Immigrants from Dominica (21.9%, a difference of 0.010%), Immigrants from Dominican Republic (21.9%, a difference of 0.050%), Bermudan (21.9%, a difference of 0.14%), Yaqui (21.9%, a difference of 0.17%), and Immigrants from Switzerland (21.8%, a difference of 0.43%).
| Demographics | Rating | Rank | Female Poverty Among 18-24 Year Olds |
| Basques | 0.2 /100 | #272 | Tragic 21.7% |
| New Zealanders | 0.2 /100 | #273 | Tragic 21.7% |
| Immigrants | Honduras | 0.1 /100 | #274 | Tragic 21.8% |
| Immigrants | Bangladesh | 0.1 /100 | #275 | Tragic 21.8% |
| Bahamians | 0.1 /100 | #276 | Tragic 21.8% |
| Immigrants | Switzerland | 0.1 /100 | #277 | Tragic 21.8% |
| Yaqui | 0.1 /100 | #278 | Tragic 21.9% |
| Spanish Americans | 0.1 /100 | #279 | Tragic 21.9% |
| Immigrants | Dominica | 0.1 /100 | #280 | Tragic 21.9% |
| Immigrants | Dominican Republic | 0.1 /100 | #281 | Tragic 21.9% |
| Bermudans | 0.1 /100 | #282 | Tragic 21.9% |
| Sub-Saharan Africans | 0.0 /100 | #283 | Tragic 22.0% |
| Tlingit-Haida | 0.0 /100 | #284 | Tragic 22.0% |
| Ottawa | 0.0 /100 | #285 | Tragic 22.0% |
| Ugandans | 0.0 /100 | #286 | Tragic 22.1% |
Demographics Similar to Haitians by Female Poverty Among 18-24 Year Olds
In terms of female poverty among 18-24 year olds, the demographic groups most similar to Haitians are Filipino (19.0%, a difference of 0.030%), Ukrainian (19.0%, a difference of 0.060%), Romanian (19.0%, a difference of 0.070%), Guamanian/Chamorro (19.0%, a difference of 0.13%), and Afghan (19.0%, a difference of 0.17%).
| Demographics | Rating | Rank | Female Poverty Among 18-24 Year Olds |
| Immigrants | Iraq | 99.2 /100 | #86 | Exceptional 18.9% |
| Immigrants | Jamaica | 99.2 /100 | #87 | Exceptional 18.9% |
| Croatians | 99.1 /100 | #88 | Exceptional 19.0% |
| Immigrants | Cabo Verde | 99.0 /100 | #89 | Exceptional 19.0% |
| Afghans | 99.0 /100 | #90 | Exceptional 19.0% |
| Romanians | 98.9 /100 | #91 | Exceptional 19.0% |
| Filipinos | 98.9 /100 | #92 | Exceptional 19.0% |
| Haitians | 98.9 /100 | #93 | Exceptional 19.0% |
| Ukrainians | 98.8 /100 | #94 | Exceptional 19.0% |
| Guamanians/Chamorros | 98.8 /100 | #95 | Exceptional 19.0% |
| Sierra Leoneans | 98.7 /100 | #96 | Exceptional 19.0% |
| Salvadorans | 98.4 /100 | #97 | Exceptional 19.1% |
| Immigrants | Jordan | 98.4 /100 | #98 | Exceptional 19.1% |
| Immigrants | Czechoslovakia | 98.3 /100 | #99 | Exceptional 19.1% |
| Chileans | 98.3 /100 | #100 | Exceptional 19.1% |