Immigrants from South Central Asia vs Haitian Female Poverty Among 18-24 Year Olds
COMPARE
Immigrants from South Central Asia
Haitian
Female Poverty Among 18-24 Year Olds
Female Poverty Among 18-24 Year Olds Comparison
Immigrants from South Central Asia
Haitians
17.6%
FEMALE POVERTY AMONG 18-24 YEAR OLDS
100.0/ 100
METRIC RATING
25th/ 347
METRIC RANK
19.0%
FEMALE POVERTY AMONG 18-24 YEAR OLDS
98.9/ 100
METRIC RATING
93rd/ 347
METRIC RANK
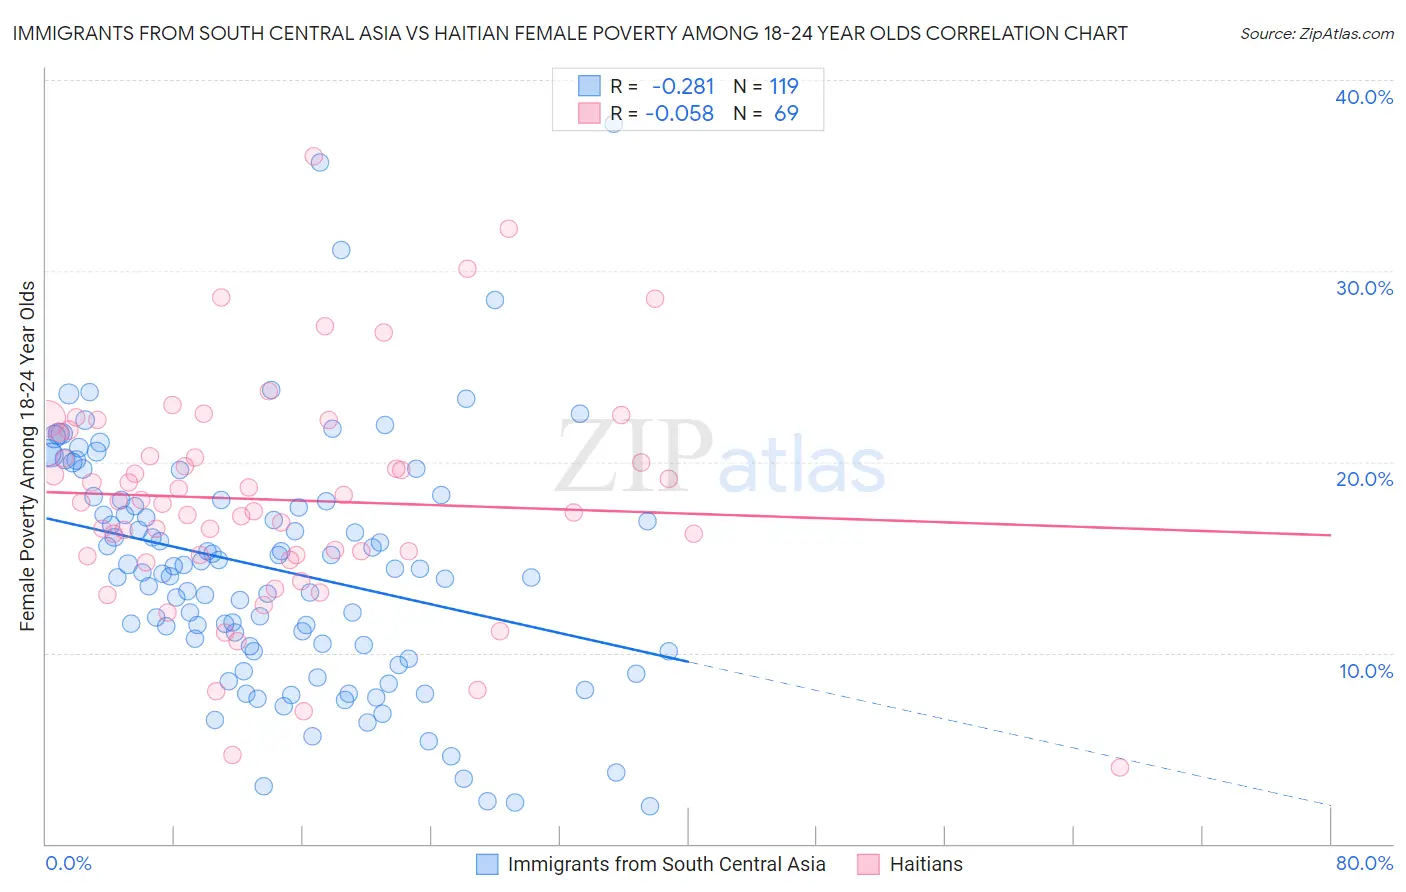
Immigrants from South Central Asia vs Haitian Female Poverty Among 18-24 Year Olds Correlation Chart
The statistical analysis conducted on geographies consisting of 457,387,696 people shows a weak negative correlation between the proportion of Immigrants from South Central Asia and poverty level among females between the ages 18 and 24 in the United States with a correlation coefficient (R) of -0.281 and weighted average of 17.6%. Similarly, the statistical analysis conducted on geographies consisting of 282,712,652 people shows a slight negative correlation between the proportion of Haitians and poverty level among females between the ages 18 and 24 in the United States with a correlation coefficient (R) of -0.058 and weighted average of 19.0%, a difference of 8.0%.
Female Poverty Among 18-24 Year Olds Correlation Summary
| Measurement | Immigrants from South Central Asia | Haitian |
| Minimum | 1.9% | 4.0% |
| Maximum | 37.7% | 36.0% |
| Range | 35.8% | 32.0% |
| Mean | 14.4% | 18.0% |
| Median | 14.4% | 17.9% |
| Interquartile 25% (IQ1) | 10.1% | 15.1% |
| Interquartile 75% (IQ3) | 18.0% | 20.9% |
| Interquartile Range (IQR) | 7.9% | 5.8% |
| Standard Deviation (Sample) | 6.4% | 5.9% |
| Standard Deviation (Population) | 6.4% | 5.9% |
Similar Demographics by Female Poverty Among 18-24 Year Olds
Demographics Similar to Immigrants from South Central Asia by Female Poverty Among 18-24 Year Olds
In terms of female poverty among 18-24 year olds, the demographic groups most similar to Immigrants from South Central Asia are Maltese (17.6%, a difference of 0.18%), Immigrants from North Macedonia (17.6%, a difference of 0.25%), Immigrants from Fiji (17.7%, a difference of 0.33%), Colombian (17.7%, a difference of 0.43%), and Venezuelan (17.7%, a difference of 0.57%).
| Demographics | Rating | Rank | Female Poverty Among 18-24 Year Olds |
| Immigrants | Colombia | 100.0 /100 | #18 | Exceptional 17.3% |
| Immigrants | Lithuania | 100.0 /100 | #19 | Exceptional 17.4% |
| Immigrants | Venezuela | 100.0 /100 | #20 | Exceptional 17.4% |
| Bolivians | 100.0 /100 | #21 | Exceptional 17.4% |
| Immigrants | Hong Kong | 100.0 /100 | #22 | Exceptional 17.5% |
| Immigrants | North Macedonia | 100.0 /100 | #23 | Exceptional 17.6% |
| Maltese | 100.0 /100 | #24 | Exceptional 17.6% |
| Immigrants | South Central Asia | 100.0 /100 | #25 | Exceptional 17.6% |
| Immigrants | Fiji | 100.0 /100 | #26 | Exceptional 17.7% |
| Colombians | 100.0 /100 | #27 | Exceptional 17.7% |
| Venezuelans | 100.0 /100 | #28 | Exceptional 17.7% |
| Portuguese | 100.0 /100 | #29 | Exceptional 17.8% |
| Immigrants | South Eastern Asia | 100.0 /100 | #30 | Exceptional 17.8% |
| Immigrants | Vietnam | 100.0 /100 | #31 | Exceptional 17.8% |
| Immigrants | Moldova | 100.0 /100 | #32 | Exceptional 17.9% |
Demographics Similar to Haitians by Female Poverty Among 18-24 Year Olds
In terms of female poverty among 18-24 year olds, the demographic groups most similar to Haitians are Filipino (19.0%, a difference of 0.030%), Ukrainian (19.0%, a difference of 0.060%), Romanian (19.0%, a difference of 0.070%), Guamanian/Chamorro (19.0%, a difference of 0.13%), and Afghan (19.0%, a difference of 0.17%).
| Demographics | Rating | Rank | Female Poverty Among 18-24 Year Olds |
| Immigrants | Iraq | 99.2 /100 | #86 | Exceptional 18.9% |
| Immigrants | Jamaica | 99.2 /100 | #87 | Exceptional 18.9% |
| Croatians | 99.1 /100 | #88 | Exceptional 19.0% |
| Immigrants | Cabo Verde | 99.0 /100 | #89 | Exceptional 19.0% |
| Afghans | 99.0 /100 | #90 | Exceptional 19.0% |
| Romanians | 98.9 /100 | #91 | Exceptional 19.0% |
| Filipinos | 98.9 /100 | #92 | Exceptional 19.0% |
| Haitians | 98.9 /100 | #93 | Exceptional 19.0% |
| Ukrainians | 98.8 /100 | #94 | Exceptional 19.0% |
| Guamanians/Chamorros | 98.8 /100 | #95 | Exceptional 19.0% |
| Sierra Leoneans | 98.7 /100 | #96 | Exceptional 19.0% |
| Salvadorans | 98.4 /100 | #97 | Exceptional 19.1% |
| Immigrants | Jordan | 98.4 /100 | #98 | Exceptional 19.1% |
| Immigrants | Czechoslovakia | 98.3 /100 | #99 | Exceptional 19.1% |
| Chileans | 98.3 /100 | #100 | Exceptional 19.1% |