Immigrants from Belarus vs Immigrants from Northern Africa Child Poverty Among Boys Under 16
COMPARE
Immigrants from Belarus
Immigrants from Northern Africa
Child Poverty Among Boys Under 16
Child Poverty Among Boys Under 16 Comparison
Immigrants from Belarus
Immigrants from Northern Africa
15.0%
CHILD POVERTY AMONG BOYS UNDER 16
95.7/ 100
METRIC RATING
101st/ 347
METRIC RANK
16.0%
CHILD POVERTY AMONG BOYS UNDER 16
71.3/ 100
METRIC RATING
160th/ 347
METRIC RANK
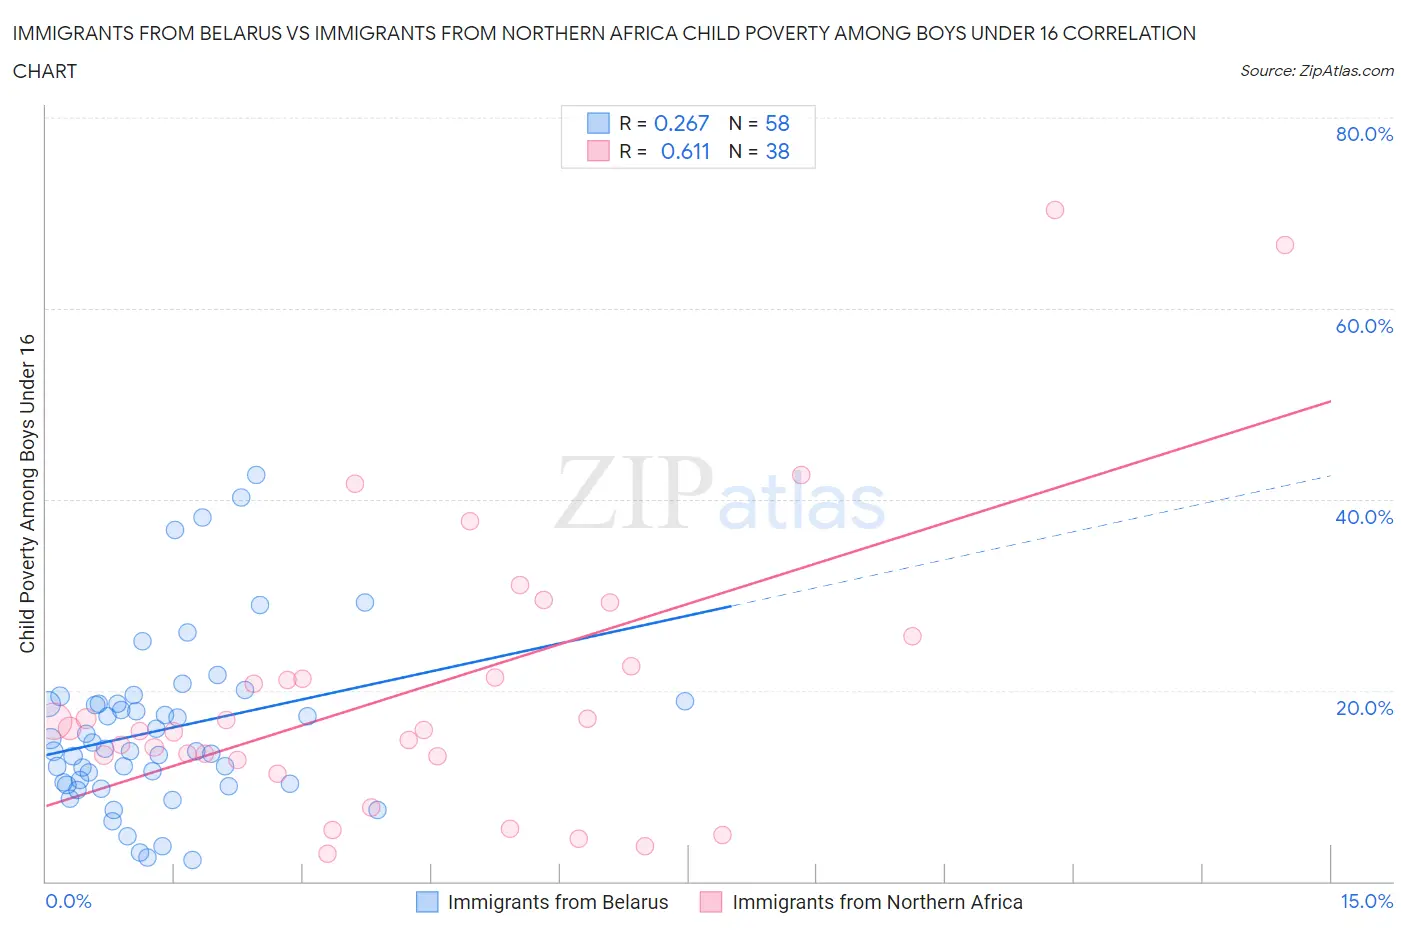
Immigrants from Belarus vs Immigrants from Northern Africa Child Poverty Among Boys Under 16 Correlation Chart
The statistical analysis conducted on geographies consisting of 148,931,301 people shows a weak positive correlation between the proportion of Immigrants from Belarus and poverty level among boys under the age of 16 in the United States with a correlation coefficient (R) of 0.267 and weighted average of 15.0%. Similarly, the statistical analysis conducted on geographies consisting of 317,001,959 people shows a significant positive correlation between the proportion of Immigrants from Northern Africa and poverty level among boys under the age of 16 in the United States with a correlation coefficient (R) of 0.611 and weighted average of 16.0%, a difference of 6.7%.
Child Poverty Among Boys Under 16 Correlation Summary
| Measurement | Immigrants from Belarus | Immigrants from Northern Africa |
| Minimum | 2.2% | 2.9% |
| Maximum | 42.5% | 70.3% |
| Range | 40.4% | 67.5% |
| Mean | 15.8% | 20.2% |
| Median | 13.7% | 15.9% |
| Interquartile 25% (IQ1) | 10.2% | 13.1% |
| Interquartile 75% (IQ3) | 18.6% | 22.5% |
| Interquartile Range (IQR) | 8.4% | 9.4% |
| Standard Deviation (Sample) | 8.8% | 15.1% |
| Standard Deviation (Population) | 8.8% | 14.9% |
Similar Demographics by Child Poverty Among Boys Under 16
Demographics Similar to Immigrants from Belarus by Child Poverty Among Boys Under 16
In terms of child poverty among boys under 16, the demographic groups most similar to Immigrants from Belarus are Chilean (15.0%, a difference of 0.050%), Romanian (15.0%, a difference of 0.070%), Immigrants from Denmark (15.0%, a difference of 0.11%), Immigrants from Switzerland (15.0%, a difference of 0.21%), and Dutch (15.0%, a difference of 0.22%).
| Demographics | Rating | Rank | Child Poverty Among Boys Under 16 |
| Immigrants | Italy | 96.7 /100 | #94 | Exceptional 14.9% |
| Finns | 96.5 /100 | #95 | Exceptional 14.9% |
| Immigrants | North Macedonia | 96.3 /100 | #96 | Exceptional 14.9% |
| Immigrants | Egypt | 96.2 /100 | #97 | Exceptional 14.9% |
| British | 96.2 /100 | #98 | Exceptional 15.0% |
| Immigrants | France | 96.1 /100 | #99 | Exceptional 15.0% |
| Chileans | 95.8 /100 | #100 | Exceptional 15.0% |
| Immigrants | Belarus | 95.7 /100 | #101 | Exceptional 15.0% |
| Romanians | 95.6 /100 | #102 | Exceptional 15.0% |
| Immigrants | Denmark | 95.6 /100 | #103 | Exceptional 15.0% |
| Immigrants | Switzerland | 95.4 /100 | #104 | Exceptional 15.0% |
| Dutch | 95.4 /100 | #105 | Exceptional 15.0% |
| Serbians | 95.2 /100 | #106 | Exceptional 15.1% |
| Jordanians | 95.1 /100 | #107 | Exceptional 15.1% |
| Immigrants | England | 94.8 /100 | #108 | Exceptional 15.1% |
Demographics Similar to Immigrants from Northern Africa by Child Poverty Among Boys Under 16
In terms of child poverty among boys under 16, the demographic groups most similar to Immigrants from Northern Africa are Immigrants from Oceania (16.0%, a difference of 0.010%), Guamanian/Chamorro (16.1%, a difference of 0.24%), Costa Rican (16.1%, a difference of 0.44%), Immigrants from Albania (16.1%, a difference of 0.46%), and Immigrants from Chile (15.9%, a difference of 0.51%).
| Demographics | Rating | Rank | Child Poverty Among Boys Under 16 |
| French | 78.7 /100 | #153 | Good 15.8% |
| Syrians | 77.5 /100 | #154 | Good 15.9% |
| French Canadians | 76.6 /100 | #155 | Good 15.9% |
| Israelis | 76.5 /100 | #156 | Good 15.9% |
| Immigrants | Nepal | 76.0 /100 | #157 | Good 15.9% |
| Yugoslavians | 75.9 /100 | #158 | Good 15.9% |
| Immigrants | Chile | 74.8 /100 | #159 | Good 15.9% |
| Immigrants | Northern Africa | 71.3 /100 | #160 | Good 16.0% |
| Immigrants | Oceania | 71.3 /100 | #161 | Good 16.0% |
| Guamanians/Chamorros | 69.6 /100 | #162 | Good 16.1% |
| Costa Ricans | 68.1 /100 | #163 | Good 16.1% |
| Immigrants | Albania | 67.9 /100 | #164 | Good 16.1% |
| Colombians | 65.2 /100 | #165 | Good 16.1% |
| Immigrants | Germany | 63.6 /100 | #166 | Good 16.2% |
| Afghans | 55.4 /100 | #167 | Average 16.3% |